Just as Micron Technology (MU) was about to post its earnings, one of the members of Exposing Earnings asked me if I could give the gameplay for this earnings report. Earnings for MU is generally easy to predict (it sells off), but this quarter’s strong fundamental growth made me wary of recommending a short play into earnings. As the earnings report hit the press, MU jumped, quickly selling off into the day.
As the day ended with an open gap, I applied my experience in gap trading and also ran my gap algorithm to ensure the gap was an area gap. Area up gaps after earnings usually have a red/black “gap day” candlestick, as you can see below. The small size of the gap and the fact that it did not bring the stock to a 20-day high told me it was most likely an area gap:

Note: Compare this gap analysis to the one I ran on Broadcom (AVGO).
As the gap was too small, I didn’t play, but I did start to question the reasoning behind the expedient post-earnings selloff. Before earnings, I ran through my standard pre-earnings analysis to find MU had strong and growing fundamentals. I wanted to understand the story here, so I dug into the earnings call.
If we follow the standard logic, an earnings release and the earnings call add a large bundle of new information into the market, readjusting the stock price to reflect previously unknown fundamental data. The updated fundamentals revealed in MU’s earnings were stronger than had been expected, beating on both EPS and revenue and therefore not justifying a selloff. But an earnings selloff can also come from the forward-looking statements in earnings calls, which is why I spent several months poring over the research in this field before opening my earnings prediction service here on Seeking Alpha.
For those uninitiated with the research, a number of factors, many conveniently consolidated in the earnings call, can predict with good statistical accuracy the effect the “guidance” portion of an earnings release will have on a stock over the period of roughly one month after earnings. The immediate selloff after strong earnings is often due to overly strong expectations, profit-taking, or the stock having already priced in earnings; but what happens afterward is often foreseeable in the earnings call.
The stock was trading at post-tech-boom highs before earnings, so the “pricing in,” overbought status, or profit-taking explanations make sense in the immediate term. The longer term cannot be told from the stock movement but from the mouths of management and, specifically, how they respond to the impromptu questions posed by the investors on the earnings call. This is where my research comes into play: I wrote an algorithm to take into consideration all the relevant factors discovered by recent research – summarized as a number, I call this the “tone” of the earnings call.
My backtests on this factor have shown the future stock price to be predictable out to one month from the earnings date by comparing the recent earnings call’s tone to that of the average for the stock. To not bore you with the details, let’s just get down to the facts. MU has an average earnings tone 43% stronger than the market average, implying fundamental growth and optimistic management. Optimism and growth are implied to be even stronger this quarter, as the earnings tone this quarter is 26% higher than normal (87% stronger than the market average).
The immediate conclusion here is that the selloff is unjustified by the additional news brought by the earnings report. The information contained within the newest report and earnings call should increase the price of the stock, thereby creating a mispricing in the market. The future predicted by my model shows MU hitting new all-time highs within a month’s time.
Looking specifically at the statements ranked highly by my earnings sentiment analysis can give us more insight into the specifics. Let’s do that:
“So now DRAM is addressing diversity of markets, I mean, several large diverse markets product portfolio meeting the needs of these markets is becoming differentiated and when that happens that always gives you stronger opportunities to drive profitable growth in that market.”
-Statement points to increased market differentiation and size in one of MU’s main products. In fact, of the major DRAM manufactures, MU has the highest revenue growth. Growth is usually capped, but when the market is undergoing growth and diversification, it is overly conservative for analysts to expect such growth to have a cap in the near future and thus the appropriate interpretation is that such growth will not only not taper off but resume and hasten in the coming months and years.
“So, I consider it as healthy if the cost declines are greater than the price declines in the industry, that"s a healthy industry environment.”
-Another statement supportive of linear-or-above growth in the industry. The cost reductions also help explain the EPS surprise as well as predict further EPS surprises in the future.
“We improved our mix of high value solutions, delivering record SSD revenues and further increasing our SSD shares.”
-Record-high fundamentals and further investment in the most profitable areas. Just as the most profitable investors increase their most profitable positions, companies with exceptional stock price growth invest more in their most profitable product categories. Note: Kelly’s formula is the proven mathematical version of this portfolio allocation strategy.
“Finally, we improved our financial foundation with the retirement of $2.4 billion of debt.”
-Significant debt reduction reduces risk to investors and insulates a stock from industry risk.
“We also shipped initial samples of our 64-layer NAND discrete UFS solution to chipset partners and customers, with very promising results.”
-Consistent pre-market product testing and client feedback are indicative of an emphasis on product quality and a profitable kurtosis (i.., “fat tail” possibilities, as opposed to the stable but limited sales that come with trivial product changes/updates) pipeline.
As I looked through my algorithm’s results, I was also surprised by the overall lack of problematic speech or language. Most companies’ earnings calls mention a number of worries and potential headwinds, but MU’s Q1 2018 report seemed entirely focused on growth, which is certainly bullish for the stock. Returning to the company’s previous earnings reports, I do find the bullish interpretation due to both growth statements and a lack of pessimism stronger and more strongly justified than in the past five years (five months’ worth of earnings call analyses).
For those who see the selloff in MU and feel skeptical about the good news, I recommend you relax. You are currently witnessing a temporary selloff due to more technical reasons, not fundamental ones. The fundamental story bolstered by the most recent earnings report justifies a new high for MU.
Despite the current selloff, my backtests still show going long MU after strong earnings to be a profitable trading strategy. The post-earnings drift on strong earnings is upward by the end of five days as well as by the end of one month. If you think this particular quarter is different from the historical data, you’d best have a reason – and you certainly can’t look to the updated fundamentals for it.
I’d love to hear the analysts explain how, in light of the most recent beats, MU’s EPS and cashflow will suddenly stop growing before 2018 is over, or how earnings will fall off in a stock that leads an expanding industry in revenue growth:
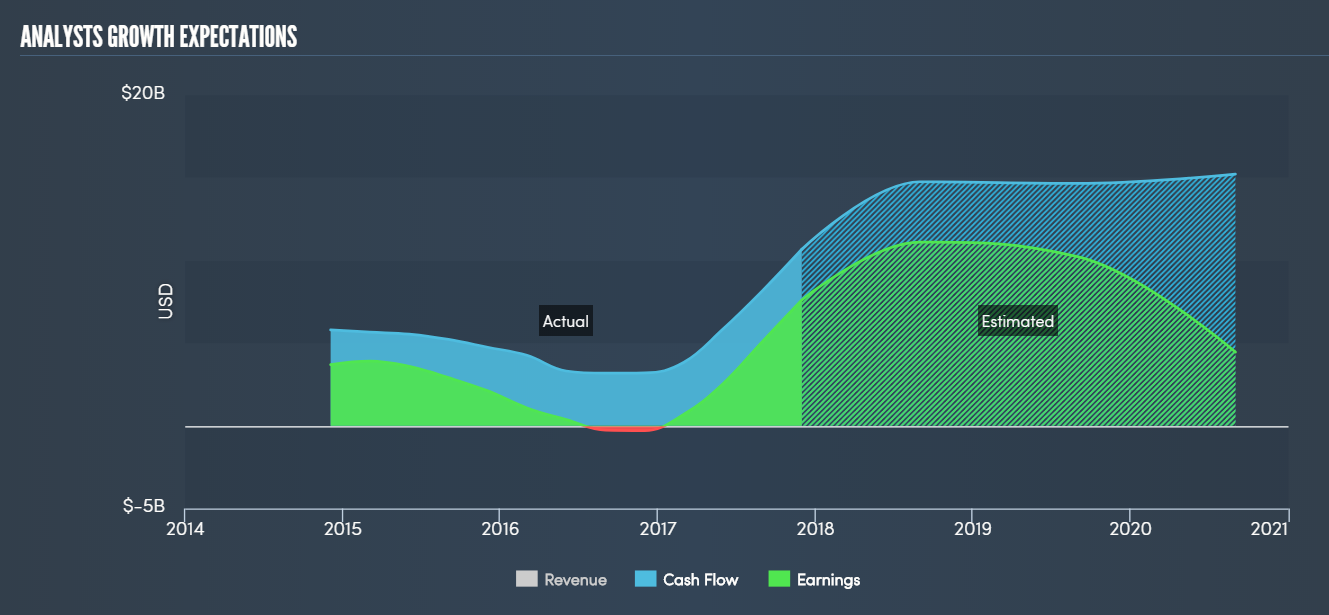
With the fundamentals in mind, I believe that MU is worth at least as much as the support level that seemed to form after earnings, at $46. That’s a conservative, short-term price. In the long-term, MU should be hitting new post-2000 highs, as it’s in better condition now that it was at its previous high.
MU investors have been rewarded with double-digit ROI over the past three months, and December is the month in which funds rebalance their portfolios, ironically selling their winners (who have grown to occupy a higher portion of the porfolios than can be comfortably shown to investors). I can think of several more reasons for this selloff, but – again – nothing fundamentally based. With the candlesticks showing a new gap – this time looking like a down area gap – I find myself tempted to play the gap as MU attempts to reach new highs, but that trade in particular will be reserved for my private “Copy My Trades” newsletter, for traders.
Note: All unlabeled figures were created by me. I used R to pull data directly from Yahoo and ADVN. Charts with blue backgrounds or options data are from Etrade Pro. Fundamental charts from a paid subscription at simplywall.st.
Note: As many have asked about the differences between my two services: Individual trade alerts (my personal trades) sent via Copy My Trades; urgent earnings trade alerts, top 5 monthly trades, and in-depth earnings predictions sent via Exposing Earnings.
A stock’s earnings report approaching usually means using a number of semi-useful, free online resources that give tertiary information and questionable earnings predictions. Stop relying on second-hand guesses. Instead, try Exposing Earnings.
Exposing Earnings is an earnings trade newsletter (live chat) that is based on statistics, probability, and backtests. My models are unavailable anywhere else online, as I designed them myself, keeping the code private for Exposing Earnings subscribers and myself. If you want a definitive answer on which way a stock will go on earnings, the probability of the prediction paying off, the risk/reward of the play, and my specific options strategy for the play, click here.
Disclosure: I/we have no positions in any stocks mentioned, but may initiate a long position in MU over the next 72 hours.
I wrote this article myself, and it expresses my own opinions. I am not receiving compensation for it (other than from Seeking Alpha). I have no business relationship with any company whose stock is mentioned in this article.

No comments:
Post a Comment