On December 20, 2017 we gave the subscribers to our Seeking Alpha Marketplace offering an early Christmas present, and that was our new Friedrich Portfolio Analyzer. The analyzer takes our Friedrich Algorithm, which can by itself only analyze one company at a time and incorporated it into a new analyzer format, using Google Sheets. By introducing this new functionality, the combined union can now analyze up to 500 stocks at a time. Once we successfully added this new ability, the next logical step was to have it analyze entire stock portfolios, ETFs or Mutual Funds.
In this article, I plan to introduce the Portfolio Analyzer to the Seeking Alpha Community and show how any subscriber can simply type in the following for each holding will, in minutes, have one’s entire stock portfolio analyzed.
- Ticker
- Shares Owned
- Cost per share
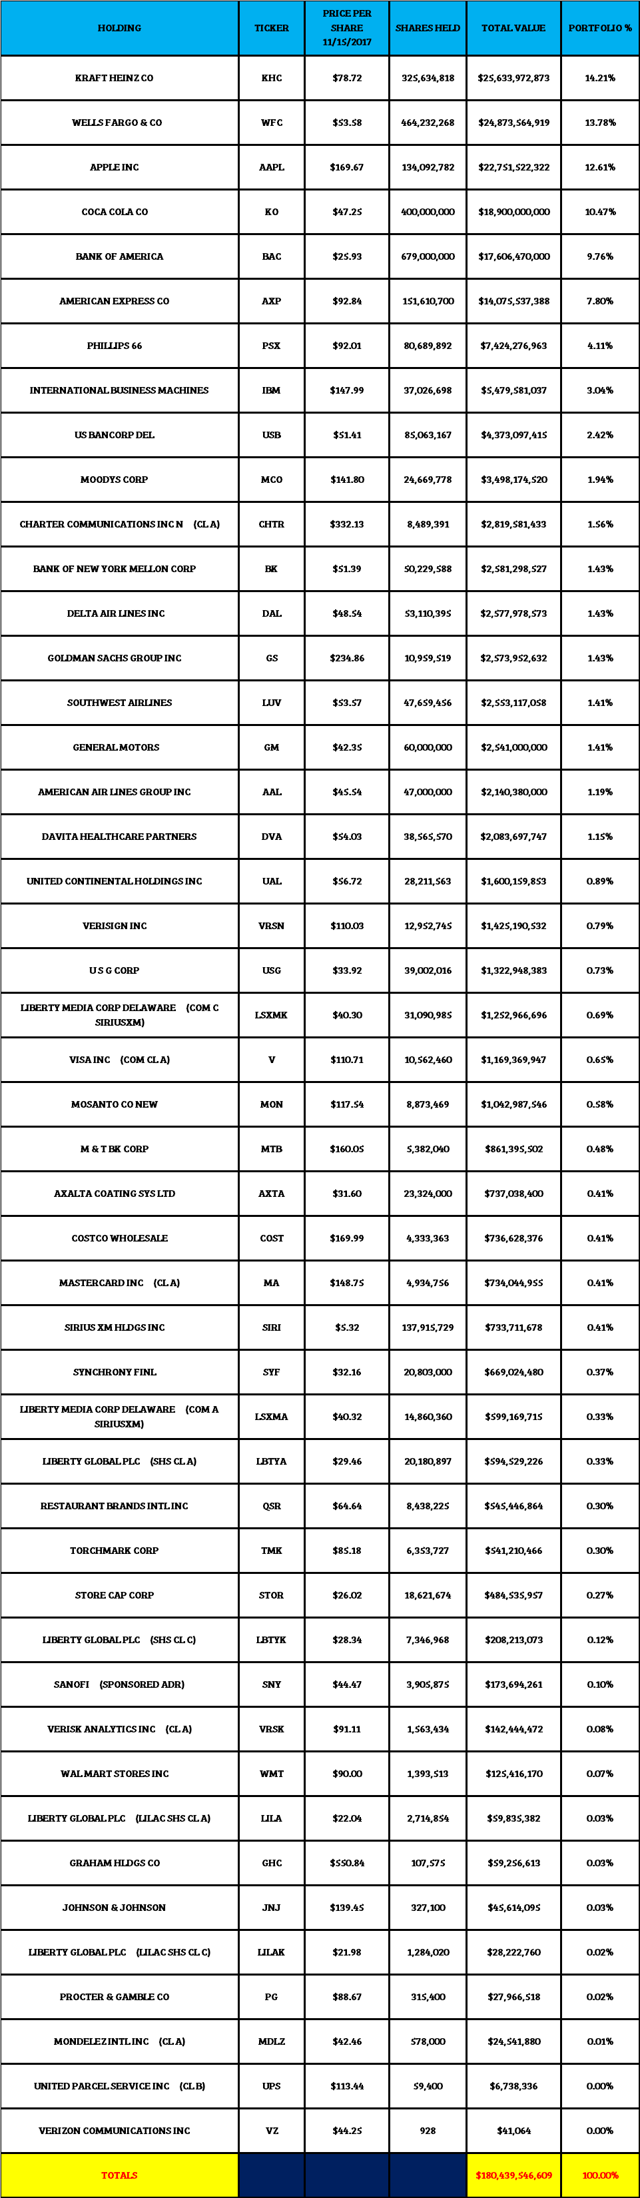
After doing so, the subscriber can then get a more complete picture of where one’s portfolio stands in real time. Since many in the Seeking Alpha community are big fans of Warren Buffett and Berkshire Hathaway, I thought I would demonstrate the power of our algorithm and Portfolio Analyzer tool by analyzing Berkshire Hathaway’s most recent holdings, that you can find below:
Berkshire Hathaway Holdings
This list comes from the Form 13-F filed each quarter with the SEC (Securities and Exchange Commission).
Explaining the Algorithm
But before doing so I first need to give everyone a small introduction in how our system works by explaining what our algorithm does and what its key output, the “Main Street” price means. Friedrich is the name given to our algorithm for analyzing companies that trade on the global stock markets. In creating it, we concentrated on analyzing each company’s Main Street operations through various established ratios, along with our own unique ratios that we developed over the last 30 years. What we came up with is a final "Main Street" price per share based on Generally Accepted Accounting Principles (GAAP) financial results, which is a framework of accounting standards, rules and procedures defined by the professional accounting industry adopted by publicly traded U.S. companies. We feel that our Main Street price result is a valuation at which each company would be attractive to a businessperson on Main Street looking to buy the entire company at a bargain.
Since the only constant in the universe is change, the results for each company fluctuate by varying degrees. No company is an island unto itself, but each operates in a world of constant change and at times in areas where Chaos is the norm. By analyzing a company’s Main Street operations over time, Friedrich is able to give our subscribers a decade long analysis (opinion) as well as offering a TTM (Trailing Twelve Month) analysis, as well. Therefore, our subscribers will not only get as close to a real-time view of operations on Main Street as is possible, but then can measure the consistency of the company’s operations over time to determine if s/he should invest or not.
Through our algorithm we can analyze ten years of Balance Sheet, Income and Cash Flow Statement data for each company (five years for international stocks) and then generate one final result (Main Street Price) in seconds. Our Algorithm uses quantitative and qualitative analysis in doing so (using our unique ratios) to find elite companies on Main Street. It is our belief that if one can successfully find such elite companies on Main Street that Wall Street will eventually notice and not be far behind in rewarding our efforts.
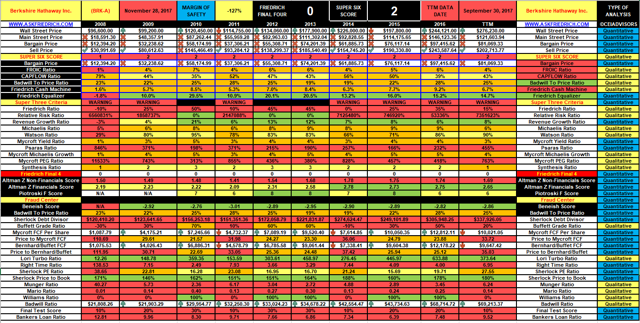
Each Datafile and Quantitative Chart we produce also acts as a backtest of our system. Here is an example of both for Apple (AAPL), which Berkshire Hathaway itself owns 134,092,782 according to its most recent 13-F filing.
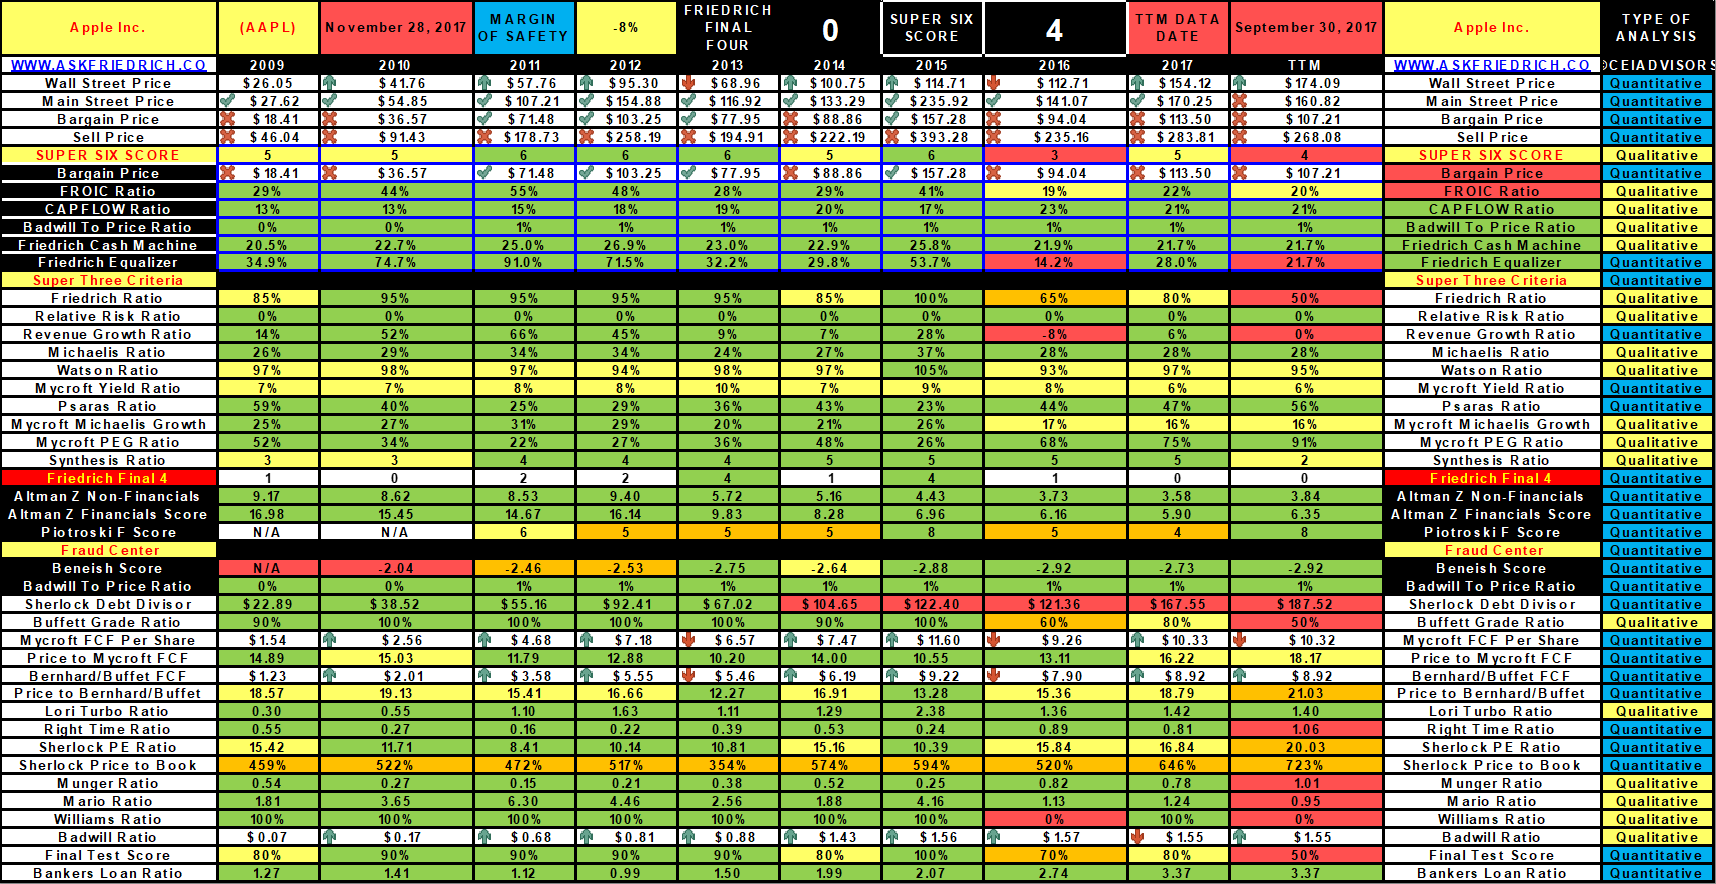
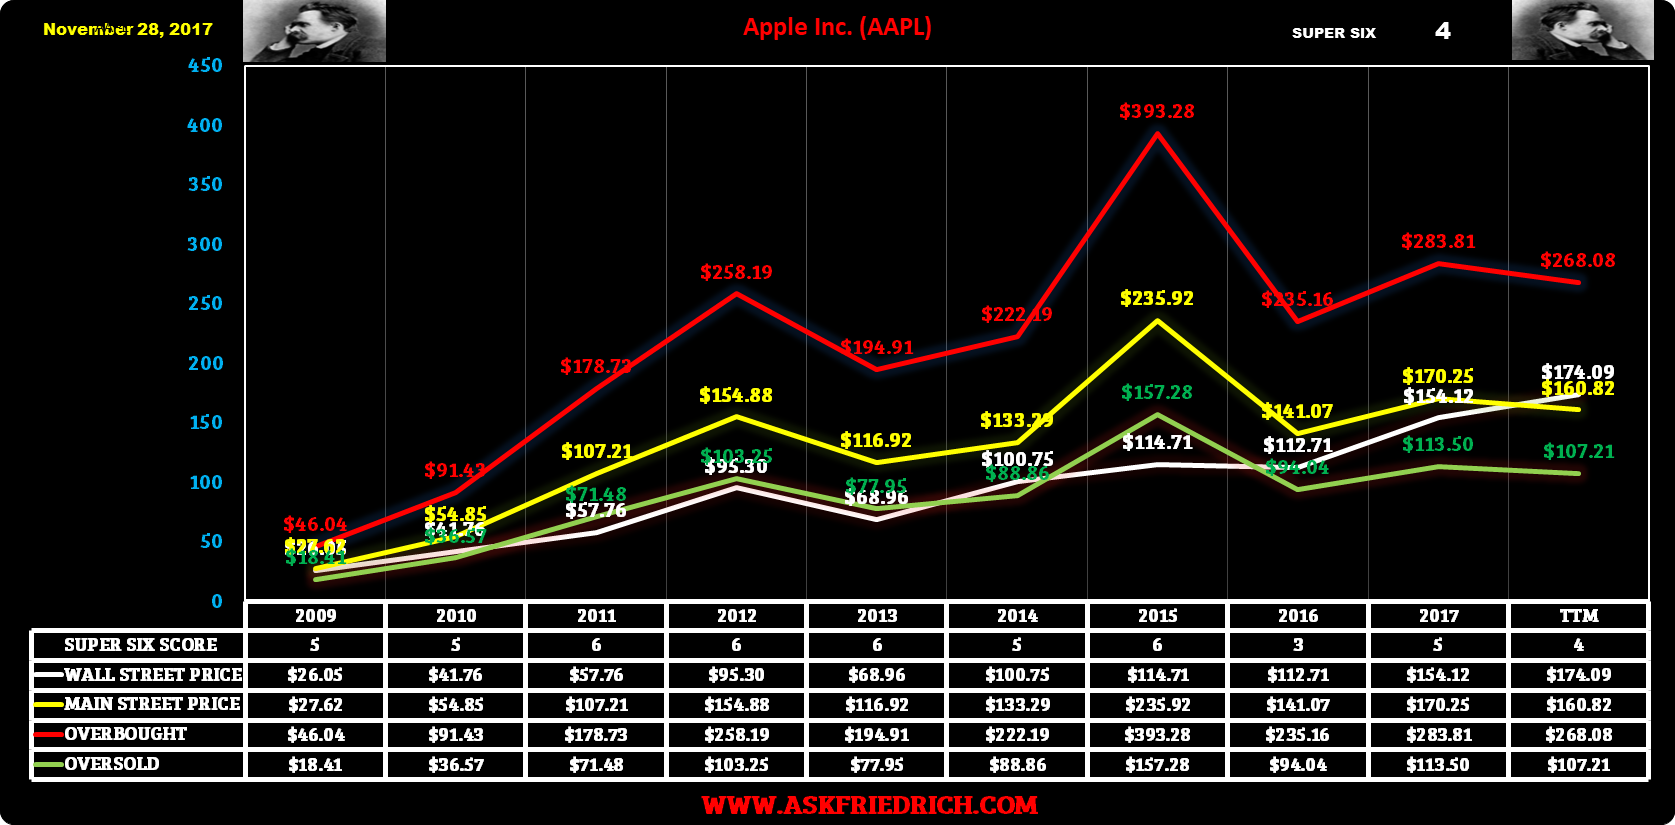
The multi-colored example above we call our “Datafile” and the chart below it is not a technical chart, but is a Qualitative Analysis chart using fundamental analysis instead of just pricing data. After Berkshire Hathaway (BRK.A) (BRK.B) released its 13-F SEC filing of its most holdings and we analyzed each using our Quantitative Charts and later using our Datafiles. From those articles realized the we needed to come up with a way to analyze the whole portfolio at one time as clearly doing it one stock at a time did not give us a complete picture. With the Analyzer we were able to get not only a clear picture that allowed us to generate results for each stock but also allowed us to come up with a result for the whole portfolio at once and track it in real time throughout the market day.
Berkshire Hathaway Top 30 Holdings Analyzed
The following is what anyone tracking Berkshire Hathaway’s holdings would see anytime they wanted to by simply accessing their Google My Drive (where all portfolios created are stored and where subscribers to our system can create unlimited portfolio analyzers).
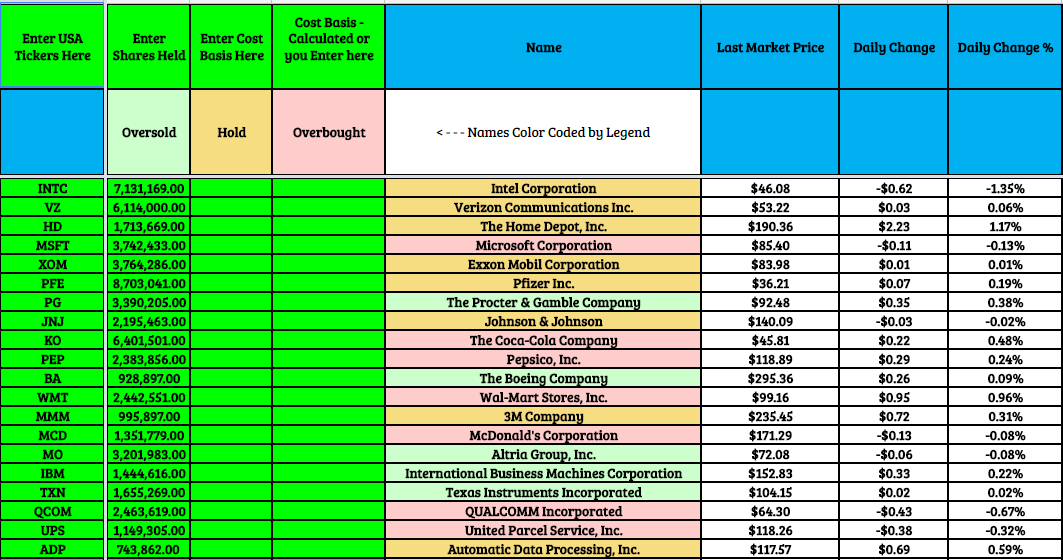
PART #1
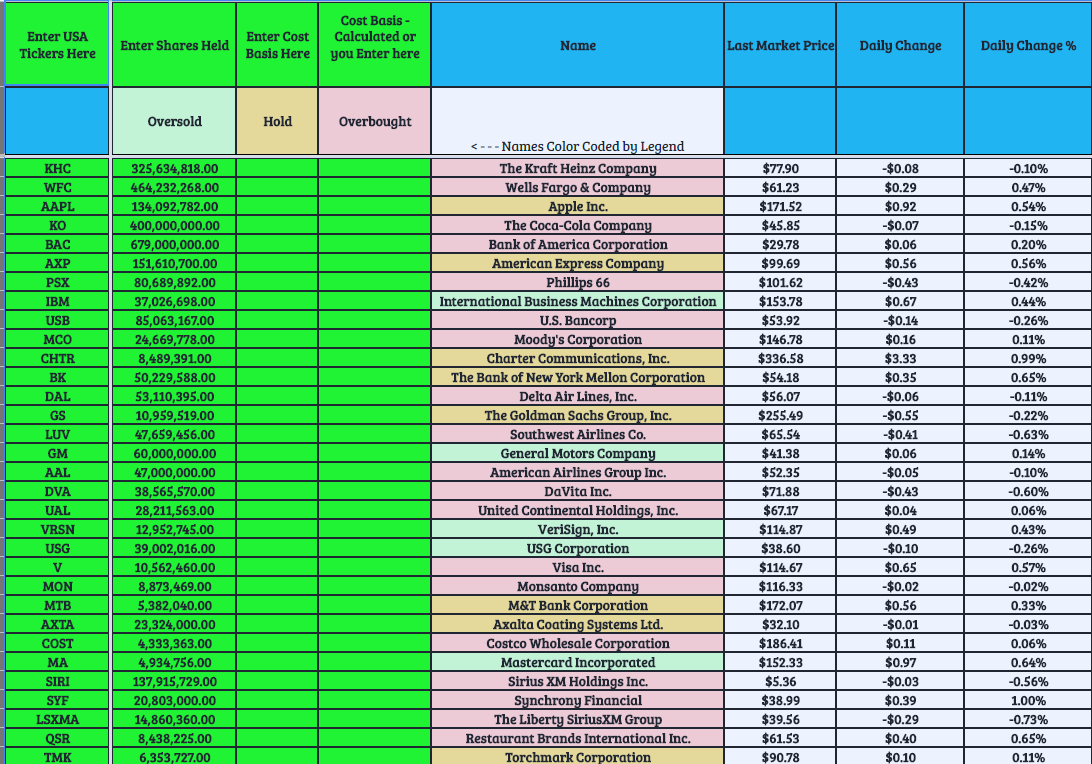
Google sheets does not allow sheets to be copied in their entirety so here are the top 30 or so holdings in the Berkshire Hathaway equity portfolio. The cost basis was not available in the 13-F filing with the SEC, so we left that blank, but our analyzer allows our subscribers the ability to constantly track such data continuously when ever they want in their own portfolios.
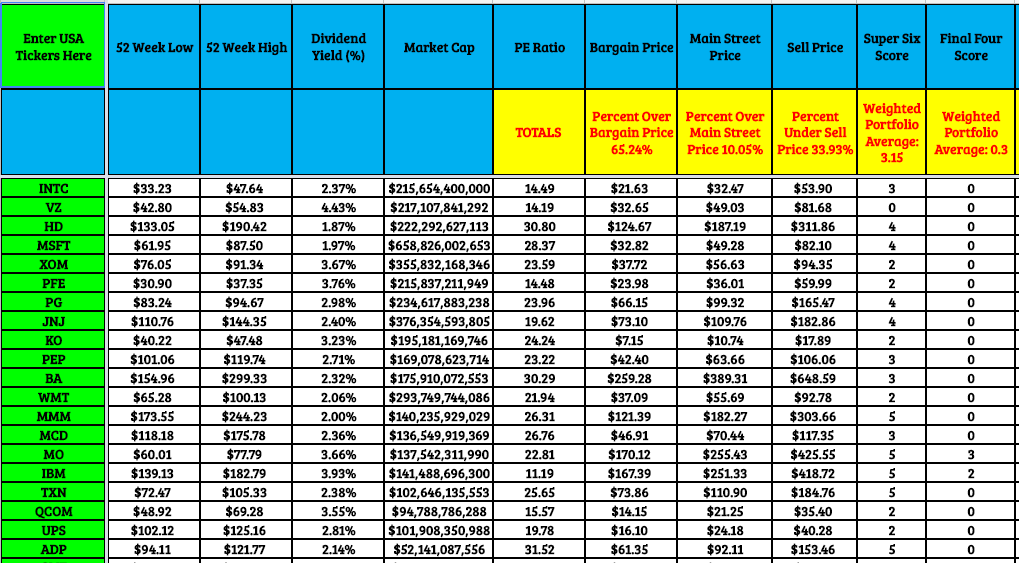
PART #2
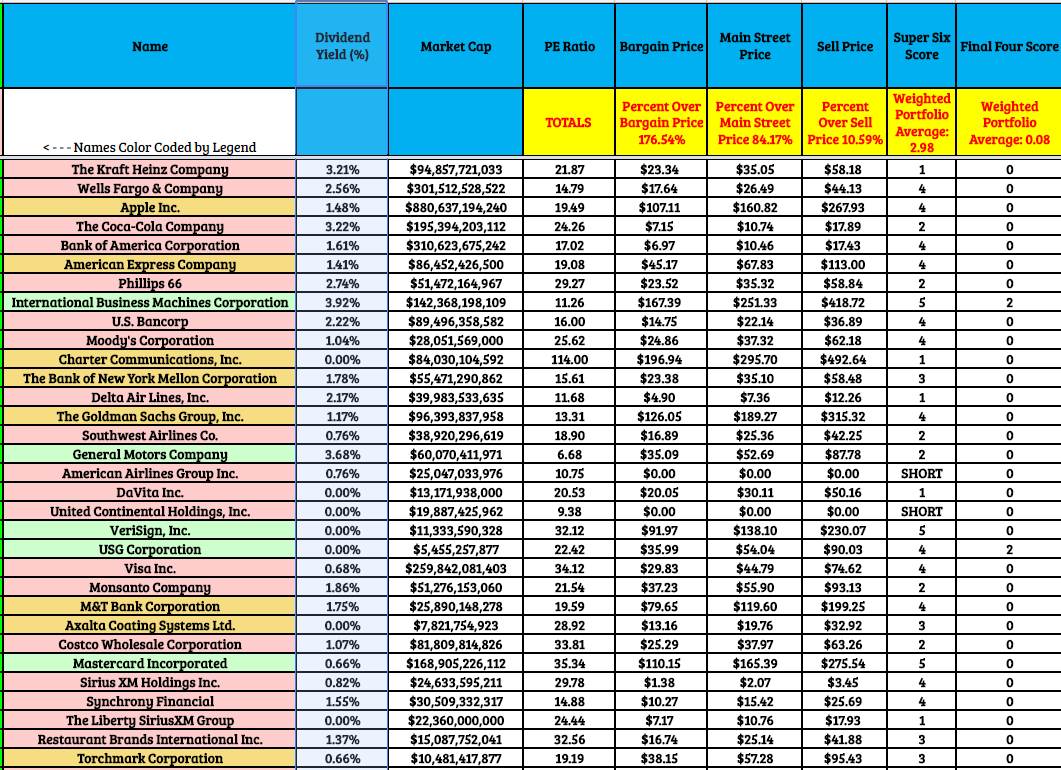
This part gives our subscribers an instant view of what the Total Market Capitalization is for each company The standard PE Ratio, our Algorithm’s Bargain Price for each company, how much the total portfolio is over or under the bargain price (bargain price is 33% below the Main Street price), our Algorithm’s Main Street Price for each company, how much the total portfolio is over or under the Main Street Price, our Algorithm’s Sell Price for each company, how much the total portfolio is over or under the sell price (sell price is 66% above the Main Street price), the Super Six Score for each stock, the weighted portfolio average score. The Super Six Score consists of the score for the Six most powerful ratio’s in our system and ranks each from 6 being the best to SHORT being the worst. The Friedrich Final Four Score is included for each stock as well as the weighted portfolio average score. To achieve the ideal Final Four Score a company must achieve the following: company must have a Super Six score of six, must have a Price to Bernhard Buffett Free Cash Flow Score of less than 15, must have a Price to Mycroft Free Cash Flow Score of less than 15, and must have a Mycroft Yield of greater than 9%
FRIEDRICH SUPER SIX CRITERIA FOR PURCHASE
1) Sell below its bargain price
2) FROIC ratio greater than 20%
FROIC = Free Cash Flow Return on Invested Capital
3) CAPFLOW less than 33%
CAPFLOW = Capital Expenditures/Cash Flow
CAPFLOW is a Management Effectiveness ratio that tells us how much cash flow is spent by management, in the form of capital expenditures, in order to run its company. A result of 33% or less is ideal and means that management has a great deal of money left over to buy back shares, invest in other firms and grow the company.
4) Badwill to Price less than 33%
BADWILL = Is a way in which Friedrich catches manipulators. When companies do a lot of Mergers and Acquisitions they tend to book a lot of Goodwill.
BADWILL = (Goodwill + Intangible Assets)/ Diluted Shares Outstanding.
When the Badwill to Price is 33% or greater than the stocks market price then the algorithm considers it is a bad thing.
5) Friedrich Cash Machine greater than 20%
FRIEDRICH CASH MACHINE = ( (MYCROFT MICHAELIS FREE CASH FLOW + BERNHARD FREE CASH FLOW)/2)/REVENUE) .
This tells us how much Free Cash flow is generated for every dollar of revenue. A company that generates 15% or more for this ratio is a CASH MACHINE.
6) Friedrich Equalizer greater than or equal to the Friedrich Cash Machine
FRIEDRICH EQUALIZER = FRIEDRICH CASH MACHINE + REVENUE GROWTH RATE . If the result is greater than or equal to the result for the FRIEDRICH CASH MACHINE then that is a good thing. Two years in a row where the result is below signals an automatic sell. Here is a perfect example of company with great numbers, but is actually a sell as its FRIEDRICH EQUALIZER is lower than its FRIEDRICH CASH MACHINE for two years in a row.
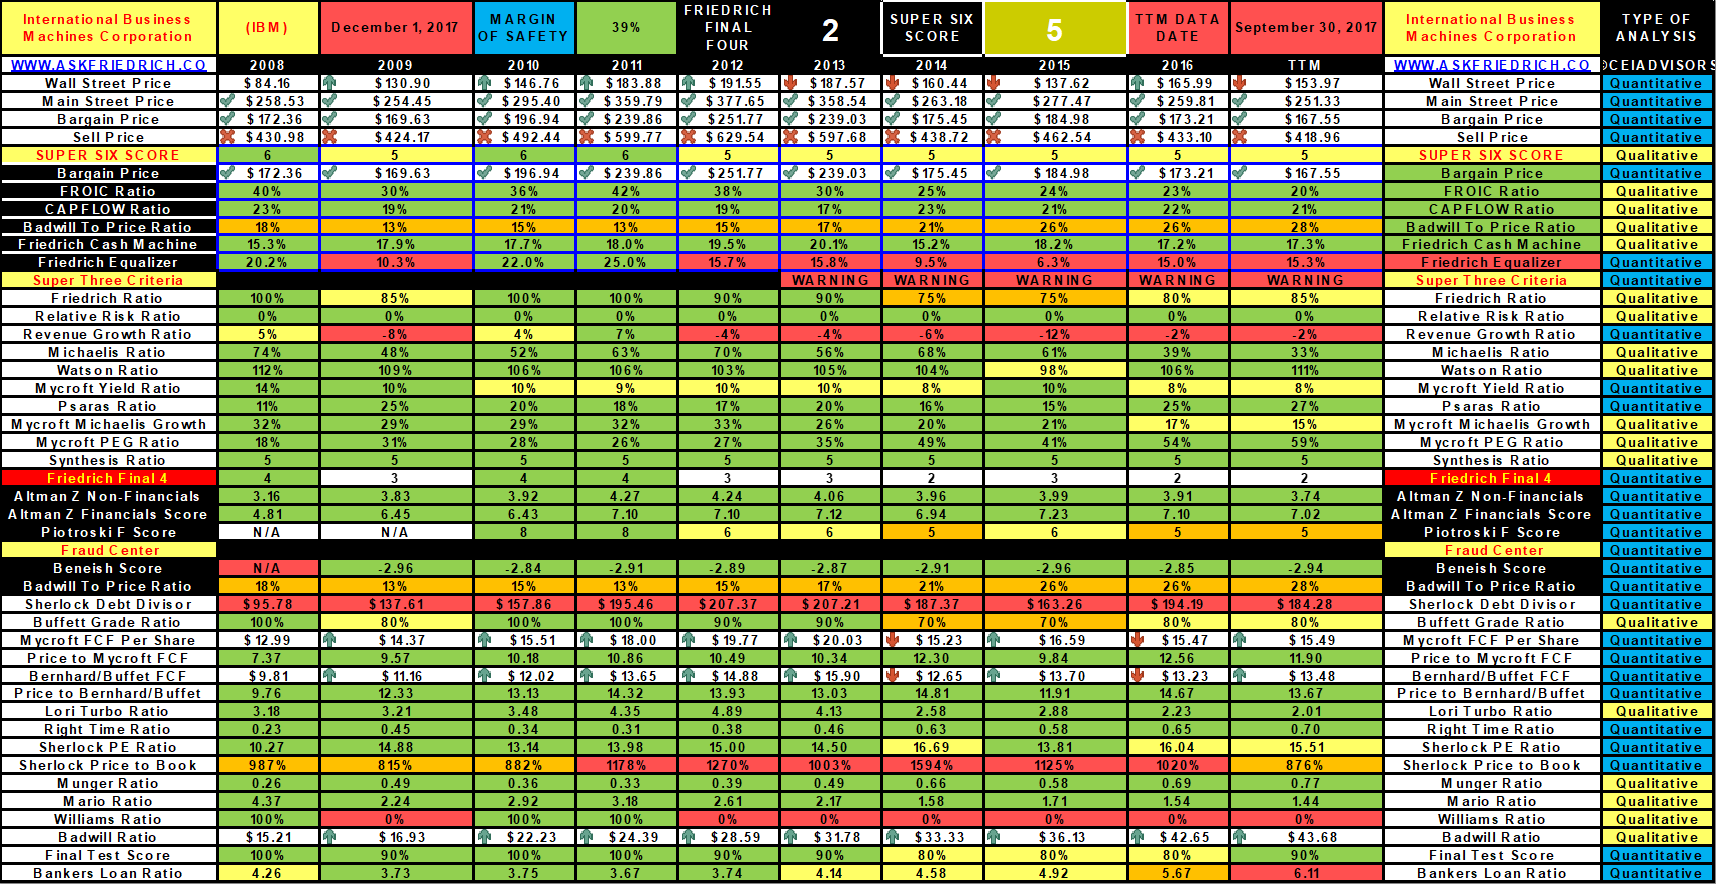
In IBM"s case it is even worse (5 years) and you would have gotten an automatic sell signal in 2013 @ $187.57 despite the strong fundamentals. This is because you never want to own anything with declining revenues. This example also clearly explains the mystery as to why Mr. Buffett’s investment in IBM did not work out so well and forced him to recently liquidate a large percentage of his original investment in the company.
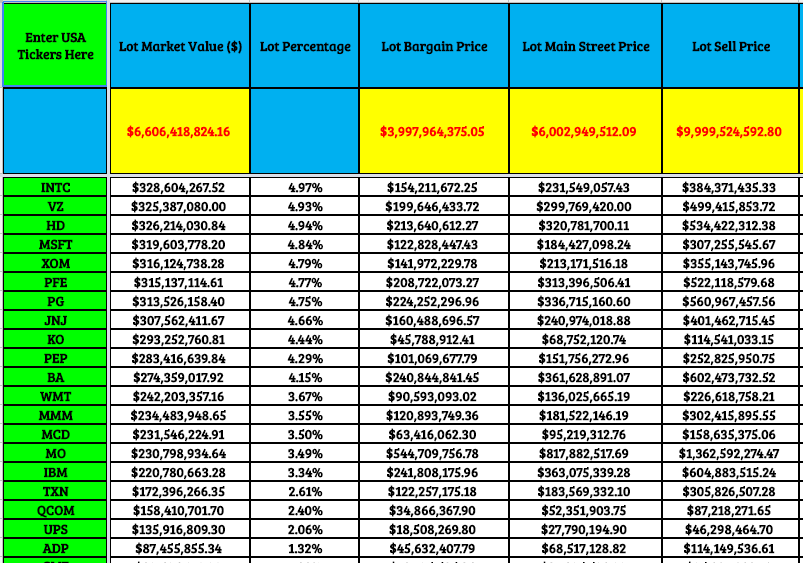
PART #3
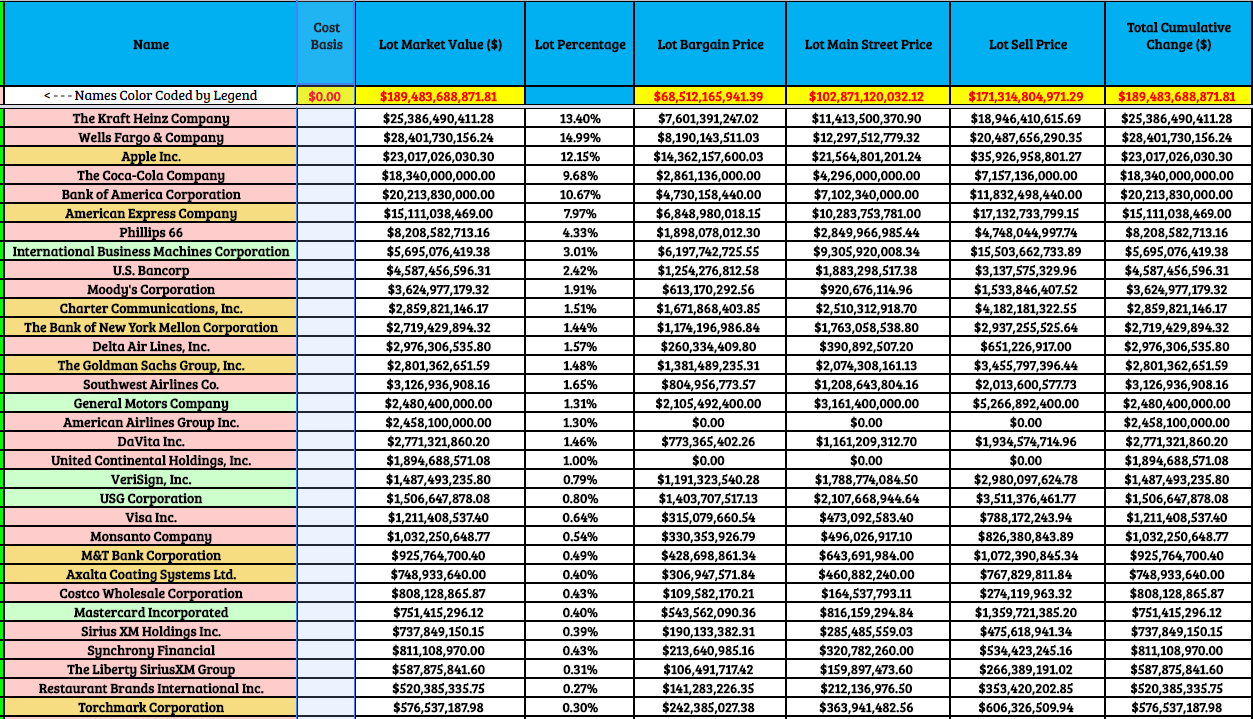
This segment of the analyzer gives us the total market value of each holding as well as the total portfolio value, the total bargain value of each holding, the total portfolio bargain value, the total Main Street value for each holding, the total Main Street portfolio value, the total sell price value for each holding and the total sell price for the portfolio.
The cumulative change is the potential profit per holding and for the total portfolio but since we were not supplied with a cost basis by Berkshire Hathaway. the analyzer simply gives us a total of zero cost.
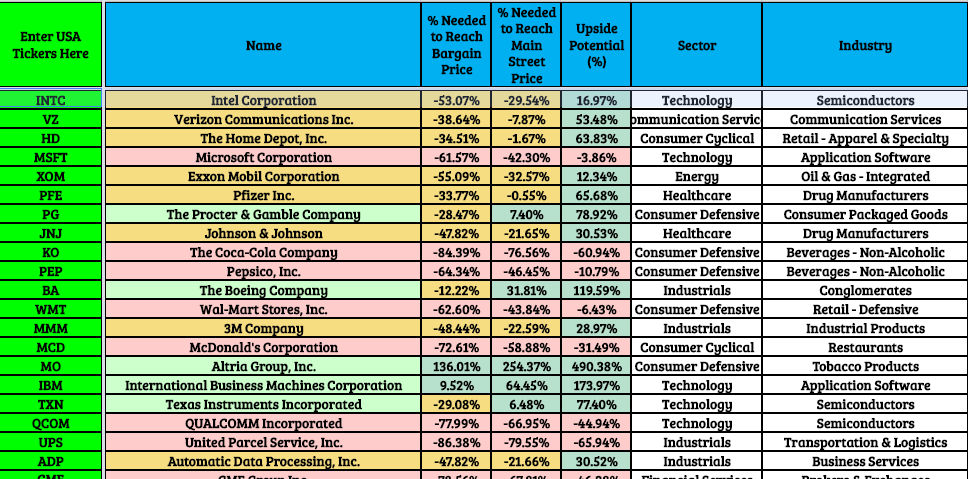
PART #4
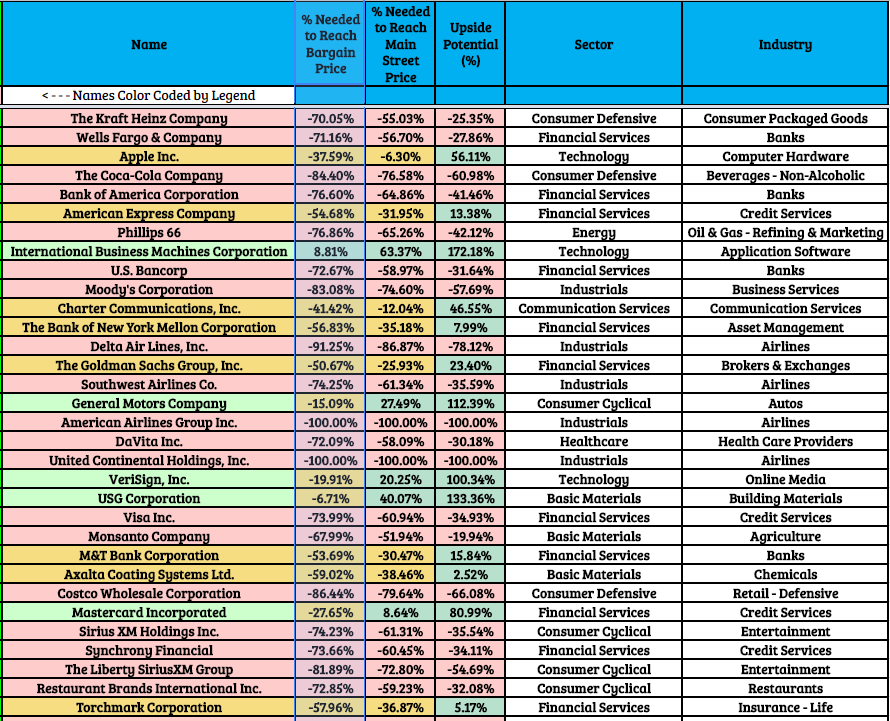
This final section gives us:
1) Percentage needed to reach each stocks Bargain Price or how much a stock must fall or rise in order to achieve it.
2) Percentage needed to reach each stocks Main Street Price or how much a stock must fall or rise in order to achieve it.
3) And probably the most important indicator that the Analyzer generates is the percentage upside potential that a subscriber can hope for in the future for each holding. As you can see from this final table, that the split is basically 50-50 for both positive vs. negative potential upside for the holdings listed.
Going forward you will notice that Mr. Buffett rarely sells once he buys a stock for his Berkshire Hathaway and that these days most of his portfolio is in its five top core holdings.
Kraft Heinz (KHC)
Wells Fargo (WFC)
Apple (AAPL)
Coca-Cola (KO)
Bank of America (BAC)
So how those five companies will perform in the future will determine how Berkshire Hathaway’s equity portfolio will perform.
Berkshire Hathaway itself is overbought but Friedrich is not able to incorporate the Buffett and Munger premium, which has always been there with the Woodstock for Capitalists. But when the great majority of Berkshire Hathaway"s holdings are overbought, it is easy to understand why Friedrich comes up with this result for (BRK.A).
Obviously, there is a premium incorporated in the stock that Friedrich cannot quantify as the stock has many permanent generational holders who are not going anywhere.
Schwab US Dividend Equity EFT Top Holdings
In Conclusion our Friedrich Portfolio Analyzer allows our subscribers to take apart the current holdings of any Portfolio, ETF or Mutual Fund and analyze each as a whole portfolio as well as analyze the individual holdings. Another example of the power of our algorithm/analyzer is a brief analysis for the top 20 holdings of the Schwab US Dividend Equity ETF (SCHD)
As you can see the Dividend ETF has a lot more percentage upside potential than the holdings of Berkshire Hathaway do.
Friedrich Model Dividend Portfolio
We do not just provide research for our subscribers, but also create Model Portfolios. For those who love investing in dividend stocks we have recently launched our Friedrich Dividend Portfolio and below is that portfolio’s performance vs. the Schwab Dividend ETF since the inception of our portfolio. We are the red line.
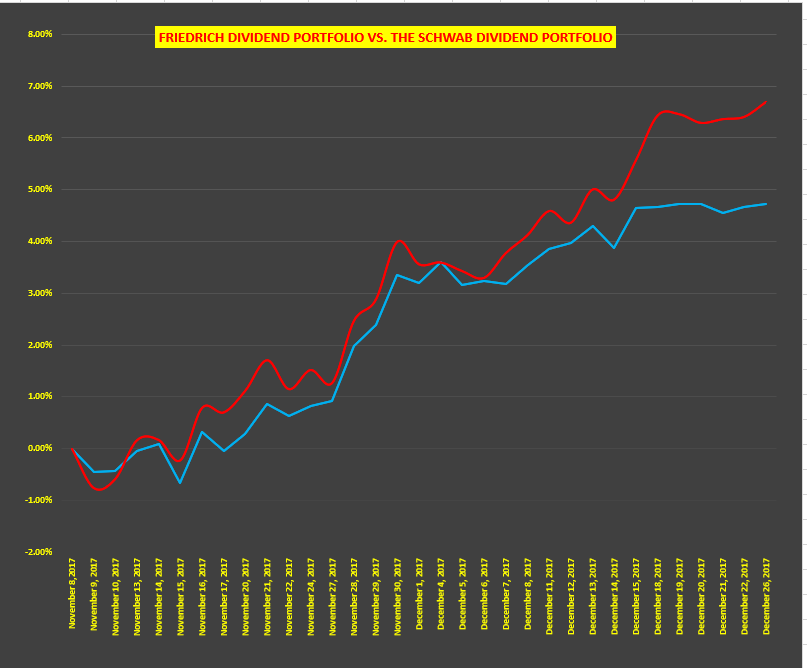
The reason that we have been able to outperform the Schwab ETF is because we have created our Dividend Portfolio based on Main Street analysis and have filled it will strong dividend payers that also have strong percentage upside potential. In the end all that matters is Main Street and how each company is performing there.
Conclusion
If you can find elite companies with elite management at the helm on Main Street, that can also be picked up at fair valuations, then eventually Wall Street will notice and reward you. Being able to sift through the thousands of stocks in minutes like our algorithm allows us to do each month helps us save time while missing fewer bargains and avoiding stocks that are overvalued. This is basically what Warren Buffett has done his entire career and why we have modeled our Algorithm on his successful approach.
If you have any questions, please feel free to ask them in the comment section below and don"t forget to hit the "Follow" button next to my name at the top of this article.
Want to know more about why we changed our tune from cautious to raging bulls? Check out this other recent article that explains why we believe the Dow could hit 50,000 in the next 6-7 years. The article includes highlights from our year-end subscriber letter.
Disclosure: I am/we are long AAPL, V, MA.
I wrote this article myself, and it expresses my own opinions. I am not receiving compensation for it (other than from Seeking Alpha). I have no business relationship with any company whose stock is mentioned in this article.
Additional disclosure: DISCLAIMER: This analysis is not advice to buy or sell this or any stock; it is just pointing out an objective observation of unique patterns that developed from our research. Factual material is obtained from sources believed to be reliable, but the poster is not responsible for any errors or omissions, or for the results of actions taken based on information contained herein. Nothing herein should be construed as an offer to buy or sell securities or to give individual investment advice.
No comments:
Post a Comment