Sure, everyone wants to buy low and sell high. However, it is easier said than done and most people fail to achieve this. As a matter of fact, the opposite may be true with a vast majority of retail investors. According to the 2014 report of Dalbar"s Quantitative Analysis of Investor Behavior (QAIB), the average investor earned a net annualized rate of return of 2.63% for the 10-year time period ending Dec. 31, 2013. The long-term returns were no better. The 20-year and 30-year annualized returns came in at just 2.53% and 1.9% respectively. It assumes that the average investor was invested in a blend of equities and fixed-income funds.
So, how can we buy low and sell high? For sure, we do not recommend market timing. But we believe there are ways that could allow you to buy low and sell high without market timing. Most of these methods fall into the realm of systematic investing approach. We are a fan of systematic investing, and many of our portfolios rely on some kind of underlying system. The main advantage of a systematic approach we see is that it eliminates the emotional response or decisions during both good times and bad, especially during market corrections or crashes.
Types of Investors:
We want to clarify that the strategy discussed in this article may not be suitable for everyone. In fact, there are three types of investors broadly. We are not including traders in our definition of investors.
- Most Passive Investors:
Actually, most passive investors should stick to investing in broad indexes or ETFs, and if they can tolerate the market gyrations, over time they will do just fine.
- Passive-Active investors:
These are the investors who are kind of in the middle. Even though they are passive due to lack of time, expertise or any other reason, but they still like to meddle in individual stocks. These investors should stick to DGI investing, meaning investing large, blue chip, dividend paying, and dividend growing companies. They could also invest a small amount of capital in growth companies.
- Active Investors:
These are the investors who like to be on top of their investments. For some, it borders on a part-time hobby. They are always in search of some alpha in the market. They are open to looking at new strategies. They are not interested in investing in S&P 500 or any other indexes, at least for most of their investment capital.
Our regular readers and follower would probably know that we fall into the last category. Normally, we advocate investment in multiple strategies. By combining many strategies, we are able to bring diversification, improve returns and reduce the overall volatility and risks. Not all strategies are going to behave the same way at all times. When one strategy zigs, some other will zag.
With this spirit of looking for alpha, we are always experimenting and backtesting new ideas. In this article, we are going to share one such idea.
Buy-Low Sell-High Strategy using DGI stocks:
This strategy is not for people who are already in the withdrawal phase. It is best suited for folks who are in the accumulation phase and still 10-20 years away from retirement. That said, it can still be used by anyone who is investing regularly in the stock market. This strategy does not require you to invest all of the money up front, but we would invest over a period of time, likely 5-10 years.
Buy Strategy:
The strategy is long-term in a selected set of stocks. Since we are going to hold these stocks for a long time, we must select stocks that represent relatively large companies, pay a good dividend and have a dividend history of at least 10 years. We want to fill at least half of our portfolio with dividend aristocrats or champions - those that have at least 25 years of dividend history with continual dividend growth. For the rest of the portfolio, we should look at companies that may have a shorter dividend history, but are moving in the right direction. For example, if we were going to construct a portfolio today, Apple Inc (NASDAQ:AAPL) and Microsoft (NASDAQ:MSFT) would fit the bill. They have less than 25 years of dividend history, but all indications are that they will continue to pay and grow their dividends.
For each stock, on a daily basis, we will calculate the average price of the previous 252 days (which is approximately one year in terms of trading days). We multiply this average price by a factor like 0.90 or 0.85 etc. giving us the “Target Price.” We will call this multiplication factor the “Buy-Low-Factor.” We will provide the details below as to how we determine this factor. Thereafter, we will compare the current price with the target price. If the current price is lower than the target price, we will buy the next lot of shares. We also determine the maximum number of shares that we want to have in any single company.
Buy-Low Factor:
For any given stock, we should look at the annual volatility. For low volatility stocks, the Buy-Low Factor would be 0.90. For medium volatility stocks, it should be 0.85. Even though our strategy will rely mostly on low or medium volatility stocks, if we have a high volatility stock in our portfolio the Buy-Low-Factor will need to be 0.80 or lower.
Example:
Stock: Proctor & Gamble (NYSE:PG)
Volatility: Low
Buy-low-factor: 0.90
Initial shares: 100
Incremental shares: 100
Maximum shares: 500
Sell Strategy:
The sell strategy is optional. If the investor really believes in the stock/company and wants to retain the investment as buy-and-hold, there is no need to adopt the sell strategy. Investors who may like to sell partially when the prices are high, may adopt this sell strategy.
As in the buy strategy, for each stock, on a daily basis we will calculate the average price of the previous 252 days (approximately one year in trading days). However, we will use multiple criteria to determine the sell decision.
- Current shares match the target-allocation
- And current-price > 1.15 times 252-days-average-price
- And current-price > 1.10 times last-buy-price (most recent buy)
- And current-price > 1.50 times our average-cost-basis in the stock.
When all four conditions are met, we will sell only a partial quantity (generally the same number of shares that we bought last time). The sell strategy could be flexible depending on the investor. Some investors may not like to sell at all and may just use the buy-and-hold approach. Some others may like to sell a partial quantity if a position has become overweight in the portfolio and thus may like to reduce the exposure.
Example:
Stock: PG
Volatility: Low
Target allocation: 500 shares
Sell-high-factor: Combination of three criteria.
No of shares to sell 100
Backtesting Results:
The strategy will have no meaning if it does not show promise in the backtesting results. For our backtesting, we initially selected 12 stocks. The stocks have been selected from various sectors/industries, though they are all solid blue-chip companies with long history of paying dividends. Since our period of backtesting is 1995-2018, we have to think what stocks should we have bought in 1995. Many of the well-established dividend companies of today (like Microsoft and Apple) had not started a dividend payment policy in 1995. Obviously, it will be almost impossible to eliminate a selection bias entirely, but we have made an effort to look at the companies as if they had met our criteria back in 1995. Even though we kept the same 12 companies in our backtesting for the entire period, in a real-life portfolio one could add new companies with time to keep the portfolio well diversified and balanced.
List of stocks:
Symbol | Company Name | Sector/Industry | |
1 | ADP | Automatic Data Processing (NASDAQ:ADP) | Business Services |
2 | ED | Consolidated Edison (NYSE:ED) | Utility |
3 | JNJ | Johnson & Johnson (NYSE:JNJ) | Healthcare/ Drug |
4 | LOW | Lowe’s Companies (NYSE:LOW) | Retail/Home Improvement |
5 | MCD | McDonald’s Corp (NYSE:MCD) | Restaurants |
6 | MMM | 3M Co (NYSE:MMM) | Industrials |
7 | MO | Altria Group (NYSE:MO) | Tobacco |
8 | PG | Proctor & Gamble (PG) | Consumer defensive |
9 | T | AT&T Inc. (NYSE:T) | Telecom Services |
10 | TXN | Texas Instruments (NYSE:TXN) | Technology/Semiconductor |
11 | WFC | Wells Fargo & Co (NYSE:WFC) | Banking |
12 | XOM | Exxon Mobil (NYSE:XOM) | Energy |
Backtesting: Buy Low and Sell High Strategy
We will buy up to 500 shares of any one stock before initiating the sell-strategy. If the number of shares falls below 500, no sale will occur, and we will buy at the next opportune time as per the strategy. The backtesting model assumes that we started investing in 1995 and ran the model until 2018.
Rules and Assumptions:
Period of testing: January 1995 – March 14, 2018
Buy rules:
- Buy the first 100 shares of each stock on the first day of the test period (Jan. 3, 1995)
- Buy any subsequent shares when the current price is less than 90% of the average price of the past year (that is 252 days).
Sell rules:
Do not sell unless the total shares of a company have reached 500.
Sell only if the current price is:
- > 1.15 times of the average price of the past year (that is 252 days)
- and > 1.10 times the price of last (most recent) purchase
- and > 1.50 times the average purchase price of the stock in our portfolio.
The system will run the check for buy and sell signals on a daily basis using end-of-day data.
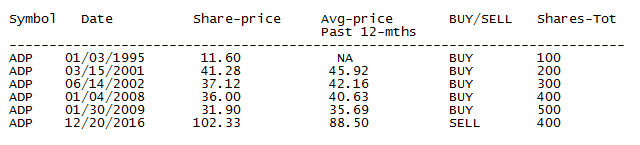
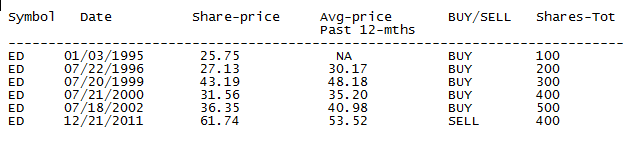
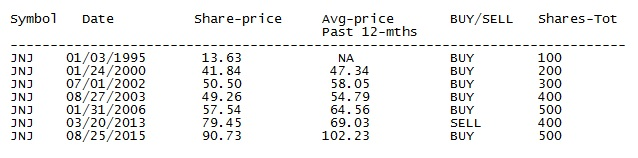
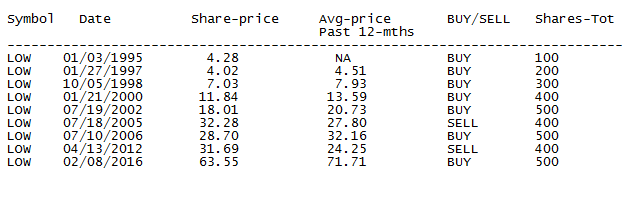
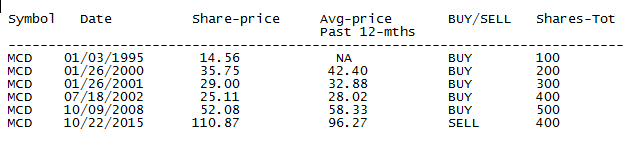
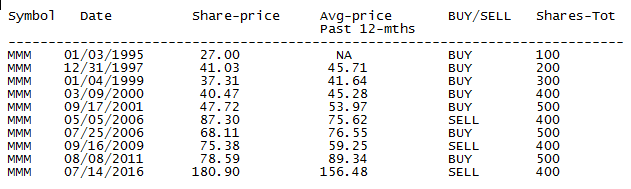
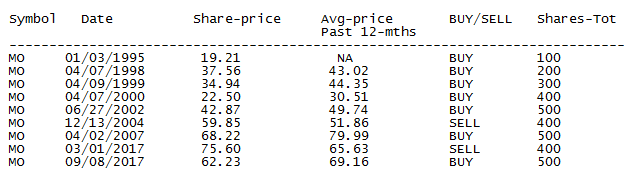
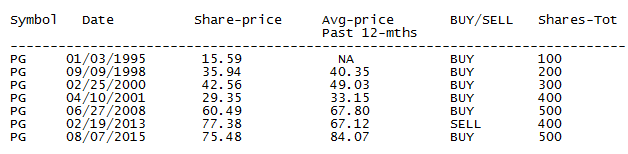
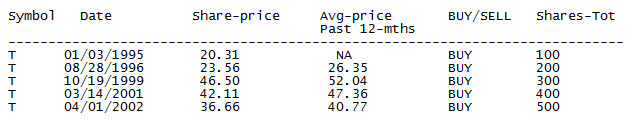
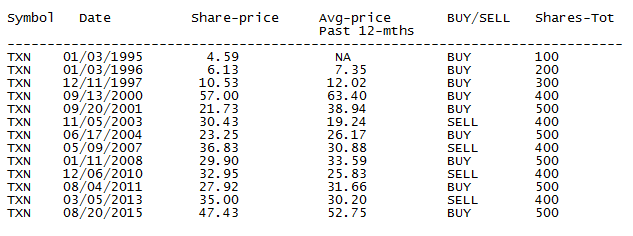
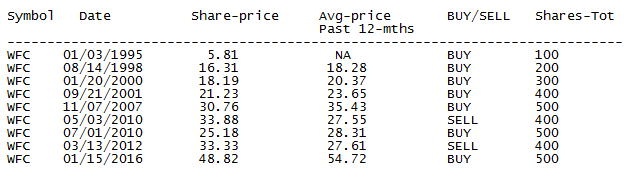
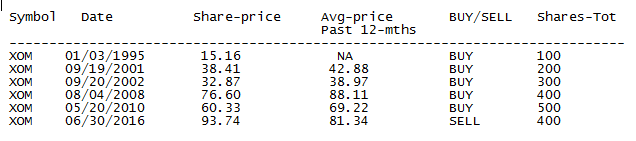
Below are the tables of buy-sell transactions as determined by our system during the period from 01/01/1995 until 03/14/2018 for each stock in our portfolio. Prices shown are split-adjusted prices.
(ADP)
(ED)
(JNJ)
(LOW)
(MCD)
(MMM)
(MO)
(PG)
(T)
(TXN)
(WFC)
(XOM)
Performance:
Below is the performance of the portfolio (with 12 securities) assuming all dividends were reinvested in the respective securities.
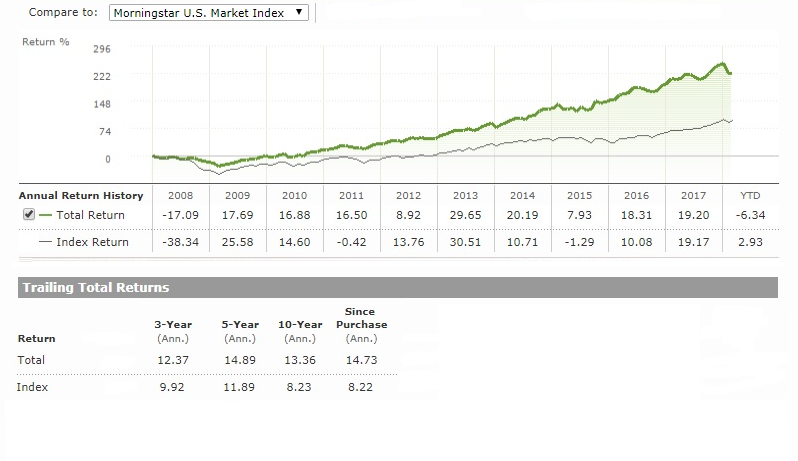
(courtesy Morningstar.com portfolio)
Adding Bank of America (NYSE:BAC) and Aflac Inc. (NYSE:AFL) to the portfolio:
Now, there will be a valid criticism that this study may have a selection bias. To remove doubts about any selection bias, let’s assume we picked some dogs on our list. We will now add two of the worst performers during the financial crisis of 2008-2009. Both companies had paid dividends for a long time, and one of them (AFL) is actually a dividend aristocrat.
Let’s first add BAC, whose share price has still not recovered to the pre-recession period. The company was dragged down due to subprime mortgage crisis to the extent that its survival was at stake. It eventually survived and recovered, but its share price still trades below its pre-recession level even after 9 years of the current bull market. The overall performance [CAGR: compound annual growth rate] came down from 14.73% a year to 14.44% - a drop but not big at all.
Now, let’s add Aflac, which was the worst of the dividend aristocrats in terms of drawdown during the 2008-09 crisis. Its share price dropped by about 80%. However, it recovered nicely during the following years. The overall performance [CAGR] improved a bit to 14.47%. However, when considering the impact of these two companies combined, it was down slightly from the level of 14.73% to 14.47%.
We could add a couple more under-performers, but the overall impact will be very small as long as the majority of the stocks are reasonably good picks.
Amounts invested over the years in the 14-stock portfolio:
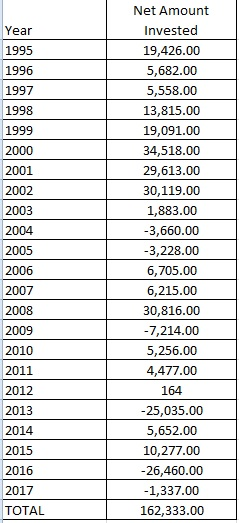
With a net investment capital of $162,333, invested in 14 stocks over the years, it grew into a large sum of almost $1.5 million over 23 years, providing a CAGR of roughly 14.50%.
Conclusion:
This portfolio is based on a predetermined, systematic approach. The portfolio does not require the entire investment up front, but allows us to invest at different times. The system is flexible, and we can decide how much we want to be invested in each stock. We can also see that even if we had selected a few stocks that did not do very well, the overall results would still have been outstanding.
Though we presented the backtesting results based on the buy and sell approach, it is entirely up to the investor if they want a pure buy-and-hold approach. Over a period of 23 years, we had fewer than 10 transactions for most stocks. In total, we had 107 transactions for 14 stocks over 23 years.
We will admit, the stock selection process (for backtesting purposes) may have some bias towards strong stocks, but we also picked stocks that performed to varying degrees at different times. For example, Exxon Mobil hasn’t done much in terms of share performance since October 2014. Bank of America had especially terrible performance during and after the financial crisis.
Essentially this portfolio strategy uses the concept of dollar cost averaging (DCA), but instead of buying at a regular interval, it only buys when the price is relatively cheap and sells when the price is relatively high.
Disclaimer: The information presented in this article is for informational purposes only and in no way should be construed as financial advice or recommendation to buy or sell any stock. Please always do further research and do your own due diligence before making any investments. Every effort has been made to present the data/information accurately; however, the author does not claim 100% accuracy. The stock portfolio presented here is a model portfolio for demonstration purposes; however, the author holds many of the same stocks in his personal portfolio.
Author"s Note: The Passive DGI Core portfolio is published as free-content. Other portfolios such as 8% Income CEF portfolio, 6% Income Risk-Adjusted portfolio, 401(k)-IRA-Conservative portfolio, Sector-Rotation ETF portfolio, and High-Growth BTF portfolio are part of our SA Marketplace service High Income DIY Portfolios. For more details or a two-week free trial, please see the top of the article just below our logo.
Disclosure: I am/we are long ABT, ABBV, JNJ, PFE, NVS, NVO, CL, CLX, GIS, UL, NSRGY, PG, MON, ADM, MO, PM, KO, DEO, MCD, WMT, WBA, CVS, LOW, CSCO, MSFT, INTC, T, VZ, VTR, CVX, XOM, VLO, HCP, O, OHI, NNN, STAG, STOR, WPC, MAIN, NLY, PCI, PDI, PFF, RFI, RNP, UTF, EVT, FFC, KYN, NMZ, NBB, HQH, JPC, JRI, TLT.
I wrote this article myself, and it expresses my own opinions. I am not receiving compensation for it (other than from Seeking Alpha). I have no business relationship with any company whose stock is mentioned in this article.

No comments:
Post a Comment