Showing posts with label Portfolio. Show all posts

Sunday, May 6, 2018

GOF - The Popular Fund You Should Not Marry Into Your Portfolio

Please Note: This article was first published for Income Idea subscribers on Thursday along with additional analysis and implementation ideas. All data in this article is as of 5/2/2018.

I have generally been a fan of actively managed funds where the management team has the flexibility to invest in a variety of asset classes where they best see fit, in line with the investment policy statements laid out in the prospectus documents.

For those reasons, many of my client portfolios will typically include a "strategic income" fund of some sort for fixed income investors. This could be either an open end mutual fund, ETF or a unit investment trust ("UIT").

Such fund typically outperform over longer periods of time however you do run into the issue where generally speaking "strategic" = "junk bonds." This applies to both taxable and tax free fixed income.

Where these funds are great however is that during flat or uncertain fixed income markets, by investing in go anywhere fixed income funds you are giving up that investment decision to the portfolio manager whom you believe has a better read on the market and more importantly is able to find those opportunities which neither you or I have access to as individuals.

Perhaps the most well known of such funds is the PIMCO Dynamic Credit Income Fund (PCI) which I wrote about in "PCI - Not For Me." My issue with the fund was that as great as it is performance wise there is a very hefty price, the lack of transparency around certain aspects and the exceptionally high leverage and fees.

Another fund that fits this bill and sponsored by one of my favorite managers is the Guggenheim Strategic Opportunities Fund (GOF). While I have looked at it a number of times for myself, I have never written about it or invested in it myself for the simple reason that I do not buy CEFs at a premium.

I did have a number of readers ask me about the fund and that is why we are taking a deep dive into the fund today, particularly as it may be just the recipe for the uncertain fixed income markets of tomorrow.

Fund Basics

  • Sponsor: Guggenheim
  • Managers: Guggenheim Partners Investment Management, LLC
  • AUM: $ 619 million in investment exposure, $ 511 million common assets
  • Historical Style: Diversified Fixed Income, predominantly below investment grade
  • Investment Objectives: The Fund seeks high total return through investment in US Government and agency issued fixed income debt and senior equity securities, corporate bonds, mortgage and asset backed securities and through utilizing an options strategy
  • Number of Holdings: 377
  • Current Yield: 10.44% based on market price, monthly distributions
  • Inception Date: 7/27/2007
  • Fees: 1.8%
  • Discount to NAV: 8.78% PREMIUM

Sources: CEF Connect, Guggenheim Website, and YCharts.

The Sales Pitch

For whatever reason the fund does a horrendous job on its website and in its marketing material to set the case for investing in the fund.

On one hand, they do not need to as the fund only raises capital at its IPO or during follow up offerings but still.... why not put up a few graphics or paragraphs outlining why investors should consider it?

Since the fund fails to do that job, I will attempt to.

As I stated in the introduction, I am a fan of go anywhere investments, especially when they can give you uncorrelated investment exposure.

A Closed End Fund structure further lets the fund use leverage and due to its structure, management does not need to have money allocated to cash for any redemptions which occur with open end mutual funds.

The CEF structure also lets you, in most cases, to purchase funds below their net asset value further generating alpha. (Although this has generally not applied to GOF.)

In the fund"s semi-annual report the fund manager does point out that "thorough research and independent thought are rewarded with performance that has the potential to outperform benchmark indexes with both lower volatility and lower correlation of returns as compared to such benchmark indexes." Source: GOF Semi-Annual Report


The Alpha/Fund Strategy

Unlike in an exchange traded or an open end index fund which follow an underlying index with their generally transparent index methodologies, no such things exist in go-anywhere, actively managed funds.

As such, investors generally rely on the information provided in the prospectus for the fund"s general investment guidelines.

As a true "strategic income" fund, the fund may invest without any limitations in fixed income securities rated below investment grade, aka junk bonds.

The fund may further invest up to 20% in non-US dollar denominated securities, including up to 10% in emerging markets.

What makes the fund relatively unique is that it may invest up to 50% in equities and up to 30% in fund of funds or pass through securities.

Source: GOF Website

The Portfolio

One of my personal attraction points to Guggenheim is their strong position in asset backed securities, particularly aerospace.

Even though this is an actively managed go-anywhere fund, it is not overly concentrated. The top 10 holdings make up just 7.98% of the fund.

Source: Guggenheim Website

Looking at the fund more broadly, even though it can allocate up to 50% to equities, the fund is currently 80% allocated to fixed income with just a bit over 15% allocated to common stocks.

Source: Guggenheim Website

Breaking it down further shows us that more than half of the fund is allocated to floating rate bank loans and ABS, or asset backed securities. In general, these are below investment grade.

Source: Guggenheim Website

High yield bonds add another 14% while investment grade corporate bonds are just under 5% of the fund.

This obviously shows up in the credit quality. More than 90% of the fund is either rated at or below BBB or not rated. More than 70% is either below investment grade or unrated.

Source: Guggenheim Website

Unfortunately due to the nature of the fund and the fund"s decision, Guggenheim does not publish some common statistics such as the average effective maturities and durations. From the transparency side this is a disservice to investors and I hope the sponsor changes it in the future.

The only reference to duration which I found was in the semi-annual report.

Source: GOF Semi-Annual Report

Guggeneheim does disclose that the fund had an average duration of about .7 years which is quite good. We do not however know whether that was leverage adjusted or not.

In either case, what this means is that for a 1% rise in interest rates, the fund"s NAV should be expected to decline by just .7%. If we have to adjust for leverage it would be closer to 1%.

The opposite is also true if interest rates decline.

Looking at the risk data we can find a 5 year beta of .997. This implies that the fund has essentially been as volatile as the underlying markets.

Source: YCharts

The maximum draw-down which the fund experienced was 54.69%, likely during the closed end fund sell off in 2007/2008 when the leverage markets dried up and funds were forced to liquidate.

Looking at the risk adjusted metrics, the fund has achieved a 10 year Sharpe ration of .7935 and a Sortino ratio of .6941. While these are not mind blowing... for a closed end fund of this nature it is quite good.

Leverage

Like most closed end funds, the Guggenheim Strategic Opportunities Fund(GOF) uses leverage.

The fund uses two primary methods for obtaining leverage.

First, the fund uses reverse repurchase agreements whereby it pledges its investments through transactions creating leverage.

As of November 2017, the fund had $ 58 million in reverse repurchase agreements with its syndicate of banks on which it paid an average weighted interest rate of 1.85%. These costs would be higher today.

Source: GOF Semi-Annual Report

The second source of leverage is a traditional credit facility with a lender.

GOF has an $ 80 million credit facility on which it pays a borrowing rate of .85% over 3 month LIBOR. On this line as of the end of November the fund had just $ 2 million outstanding as it had paid down the majority of the credit facility.

Source: GOF Semi-Annual Report

What is important to note here is that most of the CEF leverage which we have looked at is typically a spread of .7% to 1.2% over 1 Month LIBOR. In the case of GOF it is 3 month LIBOR which is a higher rate.

While generally this was a small spread, the gap is now close to .5%! As such, the fund"s current borrowing costs on this credit facility would be over 3%!

Chart

1-Month LIBOR based on US Dollar data by YCharts

Fortunately it seems that Guggenheim is employing some smart people to run the fund, namely Scott Minerd who has been quite critical of the markets. As such, the fund has been deleveraging as of late.

Source: GOF Semi-Annual Report

The Numbers

The fund is currently distributing a market price distribution yield of 10.44% and is trading at a PREMIUM of 8.78% to its NAV, or net asset value.

Source: CEF Connect

Over the previous year the fund has continued to trade at premiums although it did come very close to parity earlier this year.

Generally speaking, the Net Asset Value has failed to grow beyond its initial IPO even though there is a growth component. THIS IS QUITE CONSISTENT with the findings of the distribution analysis. A few good years bail out many bad years however there has not been meaningful growth.

Looking back over the fund"s lifetime, we can see the fund has generally traded at a premium over the previous 7 years or so however did trade at a discount in 2015/2016 and during the financial crisis when it was trading at close to 30% discounts to NAV. This is once again consistent with "junk bonds."

Chart

Performance wise, year to date the fund has been sold off with most other CEFs. The fund is up a mere .21% on a total return basis accounting for the distribution. The price per share is down 3.27% while the NAV is down 3.04%.

Do note at the price vs NAV action early this year when the fund was thrown out and decreased 9%. This is a risk to buying a fund which is trading at a premium as any sustained sell off turns premiums into discounts, adding more misery to the underlying losses.

Chart

Over the previous year the fund did give investors a 10.28% total return. This came strictly from the distribution. The underlying price per share is down .6% while the net asset value fell 2.89%. Over distributed? AHA!

Chart

Over the last 3 years the story remains the same. The fund presented investors with a 36.17% total return while the price fell 2.9%. The underlying NAV declined 2.5%. A good 2016 bailed out the fund"s track record during this time.

Chart

Over the previous 5 years we have precisely the same story. The total return was all about the distribution. The underlying price per share declined 9.28% while the NAV declined 8.99%.

Chart

Going back 10 years would have you purchase the fund near the lows of the financial crisis. AS such, the fund has achieved phenomenal results. The fund would have a 270.8% total return (if reinvested). The price per share increased 24.11% while the NAV grew just 8.5%.

Chart

Since inception the numbers are not as good. The total return declines to 233.8% with a 4.38% price per share gain and an essentially flat NAV.

Chart

The moral of the story, the fund did a PHOENOMINAL job coming out of the financial crisis but it was quite volatile and since 2011 or so, has not grown its NAV in the greatest bull market yet.

Should have? Want signs of over distribution? Plain vanilla (AGG) and (MUB) grew their NAVs during this time.

Chart

To put the fund into perspective, we will take a look at the fund against a number of competing products, both levered and unlevered.

As far as "go anywhere" type funds, there are a number of competing closed end funds such as the BlackRock Multi-Sector Income (BIT), the PIMCO Dynamic Credit Income (PCI), and the DoubleLine Income Solutions (DSL) funds. PCI is managed by the PIMCO team and the DoubleLine fund is a representation of the famed Jeffrey Gundlach"s ideas.

I also wanted to take a look at how it does against a covered call fund such as the BlackRock Enhanced Global Dividend fund (BOE).

Lastly we can take a look at two unlevered open end funds, the Fidelity Strategic Income (FSTAX) and the PIMCO Total Return (PTTAX) funds.

Year to date on a total return basis we can see that generally speaking, GOF has lagged for most of the year and was actually the most impacted during the sell off in February. It has since rebounded and comes in the middle of the pack. For the year however (PCI) and (DSL) have been the best performers.

Chart

If we look over the last year we can see (GOF) has beat most of its peers coming in behind PCI. Interestingly (BIT) lead the way until the sell off this year. Also of note, even though also PIMCO managed, the open end Total Return Fund was the worst performer.

Chart

Over the last three years we have a similar story. PCI lead the way followed by GOF, DSL and BIT.

The equity focused BOE lags and is followed by the two open end funds which were quite stable. In either case, the Fidelity fund handily outperformed the PIMCO Total Return fund.

Chart

Looking back 5 years we essentially have PCI and GOF leading the way, followed by (BIT). The high performing DoubleLine fund however comes in at the bottom of the CEF pack simply due to its horrible performance in 2015.

Once again it shows the importance of risk management. It is not as import as to how much you make, and it is more important to focus on how much you DON"T LOSE!

Chart

This is ever so important for buy and hold investors.

To get a 10 year number we only have the (GOF) and (BOE) closed end funds along with our two open end funds. This is critical but we do not have any idea how (PCI), (BIT) and (DSL) would perform during a financial crisis.

As we can see, the two closed end funds were decimated during the crisis. While GOF recovered, BOE never did. In fact, the plain vanilla open end Fidelity income fund would provide better total returns than an equity CEF fund.

Chart

Overall, GOF has been a good fund especially if we consider that it has been generally less levered than its peers. More importantly from the risk management perspective the fund is leading the way in delevering while its peers are increasing their leverage to maintain the distribution level.

Bottom Line

Guggenheim is an experienced manager and if you want to capitalize on and follow Scott Minerd, (GOF) is a way to do so. Here is a good article on Scott Minerd"s recent thoughts.

From the pricing side, it is very tough for most closed end fund investors I know of to justify purchasing it today, or even keeping it if you already own it.

Over the previous year the fund traded at a premium to NAV of as low as .62% to as high as 11.33%.

Source: CEF Connect

As we can see, the current 8.78% premium to NAV is quite expensive over EVERY measured time period and the Z-Score solidifies that. The right time to buy it would have been earlier this year when it was trading at near parity.

Source: CEF Connect

Overall it is certainly a peculiar time for funds like GOF, PCI and DSL.

I think a great way of thinking about them is like dating a super model. Yes, they look really pretty and you have a great time dating and you get lots of envious looks. But are they the people you believe would end up being terrific soul mates to live together and raise a family?

GOF, PCI, DSL and other high yield junk bond funds have certainly become the "popular guy/gal" and people are paying premiums for them. At the same time, high quality funds and munis have been left at the alter.

Yes, they have performed exceptionally well in a terrific bull market for both fixed income and equities, but so did the housing market in the early 2000s.

The "crazy" part comes in where on one hand we see premium prices for those funds, yet the underlying fundamentals are either turning or completely falling apart such as the distribution coverage with GOF and others.

Of course, I once again have to remind, a distribution is not a dividend and you have to take an underlying look at how the fund is doing.

Bottom line, this is certainly a fund worth owning, but perhaps when the prices are quite a bit better and we have another opportunity to buy in ONCE the tornado comes through.

In the mean time, the BlackRock Multi-Sector Income Fund (BIT) will let you play in the same space at a far lower cost, a 10% discount versus an 8.78% premium and while I have not looked at it yet, the underlying distribution coverage can"t be as bad as (GOF)?

For more information on the fund, please visit the fund"s website at Guggenheim - GOF.

For more reading on the mentioned funds, please take a look at:

If you liked this article, please follow me and click "Like This Article" below!

Income Idea subscribers do have full access to all of my previous work as part of their subscription along with the additional Distribution Quality and Implementation Ideas sections. Test Drive Income Idea for Free in a 14-Day Trial!

Enjoying the article?  Want more analysis and actionable ideas?

Subscribers also have access to additional analysis of the distribution quality, leverage, and the most likely risk factors.  Along with the additional analysis you also have my personal opinions of the investment and implementation ideas and investment alternatives.  Sign up for the Free 14 Day Trial and lock in a first year discount!

Disclosure: I/we have no positions in any stocks mentioned, and no plans to initiate any positions within the next 72 hours.

I wrote this article myself, and it expresses my own opinions. I am not receiving compensation for it (other than from Seeking Alpha). I have no business relationship with any company whose stock is mentioned in this article.


Tech

Thursday, February 15, 2018

Tracking Warren Buffett's Berkshire Hathaway Portfolio - Q4 2017 Update

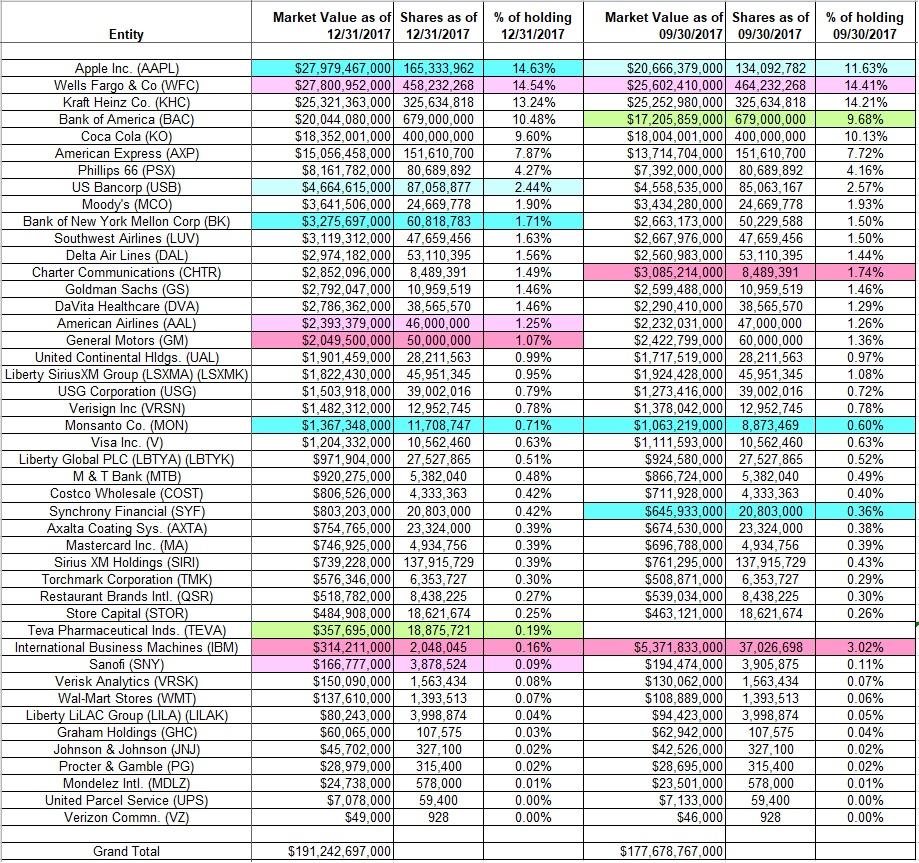
This article is part of a series that provides an ongoing analysis of the changes made to Berkshire Hathaway’s US stock portfolio on a quarterly basis. It is based on Warren Buffett’s regulatory 13F Form filed on 02/14/2018. Please visit our Tracking 10 Years Of Berkshire Hathaway"s Investment Portfolio article series for an idea on how his holdings have progressed over the years and our previous update for the moves in Q3 2017.

During Q4 2017, Berkshire Hathaway’s (BRK.A, BRK.B) US long stock portfolio value increased ~8%, from $ 178B to $ 191B. The top five positions account for ~62% of the portfolio: Apple Inc. (NASDAQ:AAPL), Wells Fargo (NYSE:WFC), Kraft Heinz Co. (NASDAQ:KHC), Bank of America (NYSE:BAC), and Coca-Cola (NYSE:KO). There are 45 individual stock positions, many of which are minutely small compared to the overall size of the portfolio.

Warren Buffett’s writings (pdfs here) are a treasure trove of information and are a very good source for anyone starting out on individual investing.

New Stakes

Teva Pharmaceuticals (NYSE:TEVA): TEVA is a very small 0.19% of the portfolio stake established this quarter at prices between $ 11.20 and $ 19.33, and the stock currently trades at $ 19.33.

Stake Disposals

None.

Stake Increases

Apple Inc.: AAPL is now the largest 13F portfolio stake at 14.63%. It was established in Q1 2016 at prices between $ 93 and $ 110, and increased by ~55% the following quarter at prices between $ 90 and $ 112. Q4 2016 saw another ~275% increase at prices between $ 106 and $ 118, and that was followed with a stake doubling in January 2017 at prices between $ 116 and $ 122. There was another ~23% increase this quarter at prices between $ 154 and $ 176. The stock currently trades at $ 167.

US Bancorp (NYSE:USB): The 2.44% USB stake has been in the portfolio since 2006. The original position was tripled during the 2007-2009 time frame. It was then kept relatively steady till Q2 2013, when ~17M shares were purchased at prices between $ 32 and $ 36. The last significant activity was a ~5% increase in Q1 2015 at prices between $ 41 and $ 45. Berkshire’s cost basis on USB is ~$ 32, and the stock is now at $ 55.31. There was a marginal increase this quarter.

Bank of New York Mellon Corp. (NYSE:BK): BK is a 1.71% of the 13F portfolio stake. The bulk of the original position was purchased in Q2 2012 at prices between $ 19.50 and $ 25. The stake was increased by 30% in Q2 2013 at prices between $ 26.50 and $ 30.50. The five quarters through Q3 2015 had seen an about-turn, as there was a combined ~20% reduction at prices between $ 36 and $ 45. Q1 2017 saw a ~50% increase at prices between $ 43.50 and $ 49, and that was followed with another similar increase the following quarter at prices between $ 46 and $ 51. There was a ~20% further increase this quarter at prices between $ 51 and $ 55. The stock currently trades at $ 55.98.

Monsanto Company (NYSE:MON): The 0.71% MON position was established in Q4 2016 at prices between $ 98 and $ 106, and the stock currently trades at $ 120. In September 2016, Bayer AG (OTCPK:BAYRY) agreed to acquire Monsanto in a $ 128 per share cash deal. The last two quarters have seen a combined ~46% stake increase at prices between $ 115 and $ 122.

Stake Decreases

Wells Fargo & Co.: WFC is Buffett’s second-largest stake at 14.54% of the US long portfolio. In recent activity, around 9M shares were sold in Q2 2017 at around $ 53 per share to bring the ownership stake below the 10% threshold. The stock currently trades at $ 59.55. Berkshire’s cost basis is at ~$ 25.50. The last two quarters have seen marginal trimming.

American Airlines (NASDAQ:AAL): AAL stake was first purchased in Q3 2016. The position is now at 1.25% of the portfolio. The original purchase was at prices between $ 28 and $ 39 and doubled in Q4 2016 at prices between $ 36.50 and $ 50. The stock is now at $ 51.07. There was a ~2% trimming this quarter.

Note: Berkshire controls 9.6% of AAL.

General Motors (NYSE:GM): GM is a ~1% of the 13F portfolio position that was first purchased in Q1 2012 at prices between $ 21 and $ 30. The stake was increased by 60% in Q2 2013 at prices between $ 27.50 and $ 35. There was a ~20% increase in Q3 2014 at prices between $ 32 and $ 38, and a similar increase in Q3 2015 at prices between $ 27 and $ 33.50. Q2 2017 saw another 20% increase at prices between $ 32.50 and $ 35.50. There was an about-turn this quarter: a ~17% selling at prices between $ 40.50 and $ 46.50. The stock currently trades at $ 41.81.

International Business Machines (NYSE:IBM): The original IBM position was purchased in Q3 2011 at prices between $ 158 and $ 185. As of Q4 2016, the share count had gone up by almost 40% through periodic purchases. There was an about-turn in Q1 2017: a ~21% selling at prices between $ 166 and $ 182, and that was followed with another ~16% reduction in early May at prices between $ 150 and $ 160. Last quarter saw another one-third reduction at prices between $ 140 and $ 156. The remaining position was almost sold out this quarter at prices between $ 145 and $ 162. The stock currently trades at ~$ 155.

Note: Berkshire’s cost basis on IBM was ~$ 170 per share.

Sanofi (NYSE:SNY): The minutely small 0.09% of the portfolio stake in SNY saw marginal trimming this quarter.

Note: Per the annual report, Berkshire has a $ 1.7B position in Sanofi - so in addition to the ADRs listed in the 13F report, Berkshire also owns Sanofi securities listed in Euronext Paris.

Kept Steady

Kraft Heinz Co.: KHC is currently the third-largest 13F stock position at 13.24% of the portfolio. Kraft Heinz started trading in July 2015, with Berkshire owning just over 325M shares (~27% of the business). The stake came about as a result of two transactions with 3G Capital as partner: a ~$ 4B net investment in 2013 for half of Heinz, and a ~$ 5B investment for the acquisition of Kraft Foods Group earlier this year. Berkshire’s cost basis on KHC is below $ 30 per share, compared to the current price of $ 71.92.

Bank of America: Berkshire established this large (top-five) 10.48% of the portfolio position through the exercise of Bank of America warrants. The warrants had a strike price of $ 7.14, compared to the current price of $ 32. The cost to exercise was $ 5B, and it was funded using the $ 5B in 6% preferred stock they held.

Note: Berkshire’s ownership stake in Bank of America is ~6.5%.

American Express (NYSE:AXP) and Coca-Cola: These two very large stakes were kept steady during the last ~4 years. Buffett has said these positions will be held “permanently”. Berkshire’s cost basis on AXP and KO are at around $ 8.49 and $ 3.25 respectively, and the ownership stakes are at ~17.5% and ~9.4% respectively.

Phillips 66 (NYSE:PSX): PSX is a fairly large 4.27% of the portfolio stake. It is a long-term position. As of Q4 2014, the stake was very small at ~0.5% of the portfolio (~6.5M shares). Q1 2015 saw a ~14% increase at prices between $ 59 and $ 80. The following quarter saw an additional ~300% increase at prices between $ 76.50 and $ 82, and that was followed with a stake doubling in Q3 2015 at prices between $ 70.50 and $ 84.50. Q2 2016 saw another ~23% increase in the high $ 70s price range. The stock currently trades at $ 93.33. Berkshire’s cost basis is $ 78.31.

Note 1: Earlier this week, it was disclosed that Phillips 66 agreed to repurchase 35M shares from Berkshire at $ 93.725 per share. Berkshire indicated the transaction’s sole purpose was to eliminate additional regulatory requirements that come with ownership stake above 10%.

Note 2: Berkshire avoided disclosing PSX stake in the original Q2 2015 13F by making use of the “Section 13(f) Confidential Treatment Requests”. An amendment filed on 9/4/2015 disclosed the huge stake build-up. Berkshire controlled ~16% of PSX at the time.

Moody’s Inc. (NYSE:MCO): MCO is a 1.90% of the US long portfolio stake. It is a very long-term position, and Buffett’s cost basis is $ 10.05. The stock currently trades at ~$ 164. Berkshire controls 11.5% of the business.

Southwest Airlines (NYSE:LUV): LUV is a 1.63% portfolio stake purchased in Q4 2016 at prices between $ 38.50 and $ 51 and increased by ~10% in the following quarter at prices between $ 49.50 and $ 59. The stock is now at $ 57.73.

Note: Berkshire owns ~7.9% of LUV.

Delta Air Lines (NYSE:DAL): DAL was a very small 0.19% position in Q3 2016. The stake saw a whopping ~850% increase in Q4 2016 at prices between $ 39 and $ 52. The stock currently trades at $ 52.20, and the stake is now at 1.56% of the portfolio. There was a ~12% trimming during H1 2017.

Note: Berkshire controls ~7.3% of DAL.

Charter Communications (NASDAQ:CHTR): CHTR is a 1.49% of the US long portfolio position. It was established in Q2 2014 at prices between $ 118 and $ 158 and more than doubled the following quarter at prices between $ 151 and $ 164. Q4 2014 saw a further ~25% increase at prices between $ 140 and $ 170. In Q2 2015, the position was again increased by ~42% at prices between $ 168 and $ 193, and that was followed with another ~21% increase the following quarter at prices between $ 167 and $ 195. Q2 2016 saw a ~10% trimming at prices between $ 198 and $ 233. The stock currently trades at $ 359, compared to Berkshire’s cost basis of around $ 160. There was a ~10% trimming last quarter.

Note: Berkshire controls ~3.4% of CHTR.

Goldman Sachs (NYSE:GS): GS is a 1.46% of the US long portfolio stake established in Q4 2013. Berkshire Hathaway received $ 5B worth of warrants to buy GS stock during the financial crisis (October 2008) at a strike price of $ 115 (43.5M shares) that was to expire October 1, 2013. Buffett exercised the right before expiry to start this long position. Q3 2015 saw a ~13% reduction at prices between $ 172 and $ 213. It currently trades at ~$ 263.

DaVita Inc. (NYSE:DVA): DVA is a 1.29% of the US long portfolio position that was aggressively built up over several quarters: the original stake was doubled in Q1 2012, increased by over 50% in Q2 2012, 24% in Q4 2012, and an additional 16% in Q1 2013. There has been marginal buying since. The bulk of the stake build-up happened at prices between $ 30 and $ 49. The stock currently trades at $ 74.75, compared to Berkshire’s overall cost basis of $ 45.33.

Note 1: Berkshire’s ownership stake in DVA crossed the 20% ownership threshold last quarter as a result of buybacks at DaVita.

Note 2: In May 2013, Berkshire’s Ted Weschler signed an accord with DVA, limiting open market purchases to 25% of the company.

United Continental Holdings (NYSE:UAL): A minutely small 0.18% UAL position as of Q3 2016 saw a huge ~540% increase in Q4 2016 at prices between $ 52.50 and $ 76. It currently goes for $ 65.68. The stake is at ~1% of the portfolio.

Note: Berkshire controls ~9.3% of UAL.

Liberty SiriusXM Group (LSXMA, LSXMK): The tracking stock was acquired as a result of Liberty Media’s recapitalization in April 2016. Shareholders received 1 share of Liberty SiriusXM Group, 0.25 share of Liberty Media Group, and 0.1 share of Liberty Braves Group for each share held. Berkshire held 30M shares of Liberty Media, for which he received the same amount of Liberty SiriusXM Group shares. There was a ~40% stake increase in Q2 2017 at a cost basis of ~$ 40 per share. The stock is now at $ 41.77.

Note: LSXMA/LSXMK is trading at a significant NAV discount to the parent Sirius Holdings" (NASDAQ:SIRI) valuation. For investors attempting to follow Buffett, LSXMA/LSXMK is a good option to consider for further research.

USG Corporation (NYSE:USG): USG is a very long-term holding, and there was a significant 21.39M share stake increase in Q4 2013 due to conversion of notes at $ 11.40 per share - Berkshire acquired the convertible notes during the financial crisis (2/2009), and USG opted to redeem them on 12/16/2013. Q2 2014 saw a ~12% stake increase at prices between $ 30 and $ 33. The stock currently trades at $ 33.88. Buffett controls around 27% of the business, and his cost basis is ~$ 19.

Verisign Inc. (NASDAQ:VRSN): VRSN was first purchased in Q4 2012 at prices between $ 34 and $ 49.50. The position was more than doubled in Q1 2013 at prices between $ 38 and $ 48. The following quarter saw a one-third increase at prices between $ 44 and $ 49. Q1 and Q2 2014 also saw a combined ~17% increase at prices between $ 47 and $ 63. The stock currently trades at $ 114, and the position is at 0.78% of the portfolio (~10% of the business).

Liberty Global PLC (LBTYA, LBTYK): The position was established in Q4 2013 at prices between $ 37.50 and $ 44.50 (adjusted for the 03/2014 stock split) and increased significantly in the following two quarters at prices between $ 38.50 and $ 46. The three quarters through Q1 2016 had also seen a combined ~30% increase at prices between $ 30 and $ 50. Q2 2016 saw a ~17% further increase at prices between $ 27 and $ 39. The stock is now at $ 34.92, and the stake is at 0.51% of the 13F portfolio.

Note: Berkshire controls 7.9% of Liberty Global.

Sirius XM Holdings: The 0.39% SIRI stake was purchased in Q4 2016 at prices between $ 4.08 and $ 4.61. Q2 2017 saw selling: a ~20% reduction at prices between $ 4.70 and $ 5.50. The stock is currently at $ 6.09.

Synchrony Financial (NYSE:SYF): SYF is a 0.42% of the portfolio position purchased in Q2 2017 at prices between $ 26.50 and $ 34.50 and increased by ~20% last quarter at prices between $ 28.50 and $ 31.25. The stock is now at $ 36.70.

Note: Synchrony is the private-label credit card business spin-off from GE that started trading in August 2014 at ~$ 23 per share. It has seen recent super-investor interest - Baupost Group has a ~10% portfolio stake.

Axalta Coating Systems (NYSE:AXTA): AXTA is a small 0.39% of the portfolio stake established in Q2 2015 at prices between $ 28 and $ 36 and increased by ~16% the following quarter at prices between $ 24.50 and $ 33.50. The stock currently trades at $ 30.84. Berkshire owns ~9.8% of the business.

Restaurant Brands International (NYSE:QSR): QSR is a 0.27% of the 13F portfolio position established in Q4 2014 at prices between $ 35 and $ 42. The stock currently trades well above that range at $ 57.71. It started trading in December 2014 following a merger/rename transaction between Tim Hortons and Burger King Worldwide.

Note: Berkshire’s stake in the business is ~4.2%.

Store Capital (NYSE:STOR): The 0.25% STOR stake was established in Q2 2017 in a private placement transaction at $ 20.25 per share. The stock is now at $ 23.41.

Costco Wholesale (NASDAQ:COST), Graham Holdings (NYSE:GHC), Johnson & Johnson (NYSE:JNJ), Liberty LiLAC Group (LILA, LILAK), Mondelez International (NASDAQ:MDLZ), M&T Bank (NYSE:MTB), MasterCard Inc. (NYSE:MA), Procter & Gamble (NYSE:PG), Torchmark Corporation (NYSE:TMK), United Parcel Service (NYSE:UPS), Verisk Analytics (NASDAQ:VRSK), Verizon Communications (NYSE:VZ), Visa Inc. (NYSE:V), and Wal-Mart Stores (NYSE:WMT): These are very small positions (less than ~0.5% of the portfolio each) kept steady this quarter.

Note: Since November 2015, Warren Buffett is known to own ~8% of Seritage Growth Properties (NYSE:SRG) at a cost basis of $ 36.50 in his personal portfolio. It currently trades at $ 38.96. SRG is a REIT spin-off from Sears Holdings (NASDAQ:SHLD) that started trading in July 2015.

The spreadsheet below highlights changes to Berkshire Hathaway’s US stock holdings in Q4 2017:

Warren Buffett - Berkshire Hathaway - Q4 2017 13F Report

Disclosure: I am/we are long BAC, GM.

I wrote this article myself, and it expresses my own opinions. I am not receiving compensation for it (other than from Seeking Alpha). I have no business relationship with any company whose stock is mentioned in this article.

Editor"s Note: This article discusses one or more securities that do not trade on a major U.S. exchange. Please be aware of the risks associated with these stocks.


Tech