Investment Thesis
The DCF valuation clearly indicates that Facebook (FB) is undervalued.
On August 16, I discussed the current state of Facebook’s capitalization through its multiples. Today, as promised, I present my DCF valuation of Facebook.
The quality of the DCF model is significantly determined by the quality of the revenue forecast included in it. So, let’s start with that.
Generally speaking, Facebook’s revenue is calculated by multiplying the number of its monthly active users by the average level of monetization of each of these users. So, forecasting the future of Facebook"s revenue, you must carefully consider these two parameters.
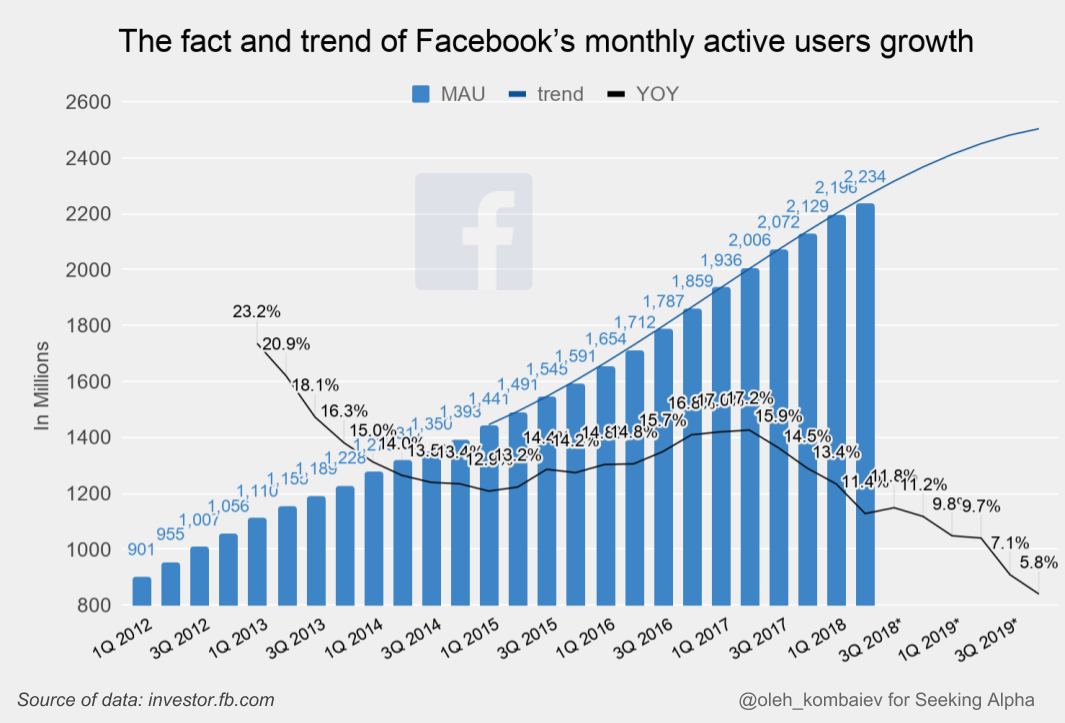
Facebook’s financial performance for the last quarter confirmed what had to happen sooner or later. Namely, the growth rate of Facebook’s active audience showed distinct signs of a slowdown. And, although before 2018, the trend of Facebook’s monthly active user growth anticipated was as many as 2.6 billion users by the end of 2019...
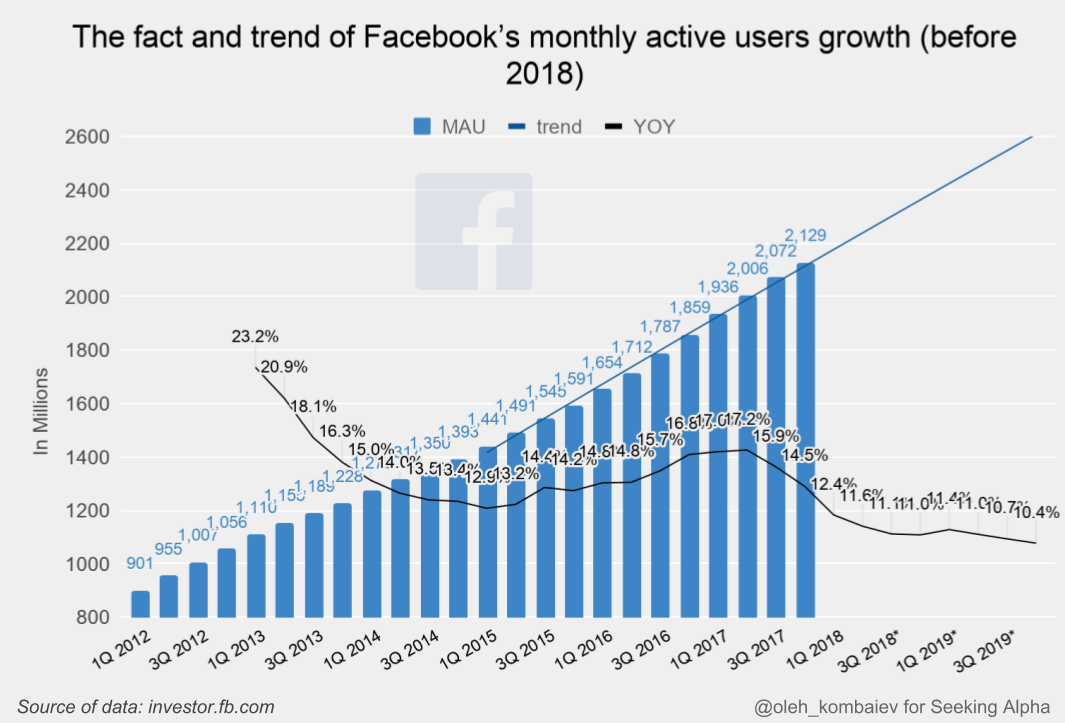
...this goal looks unattainable taking into account the results of the last two quarters:
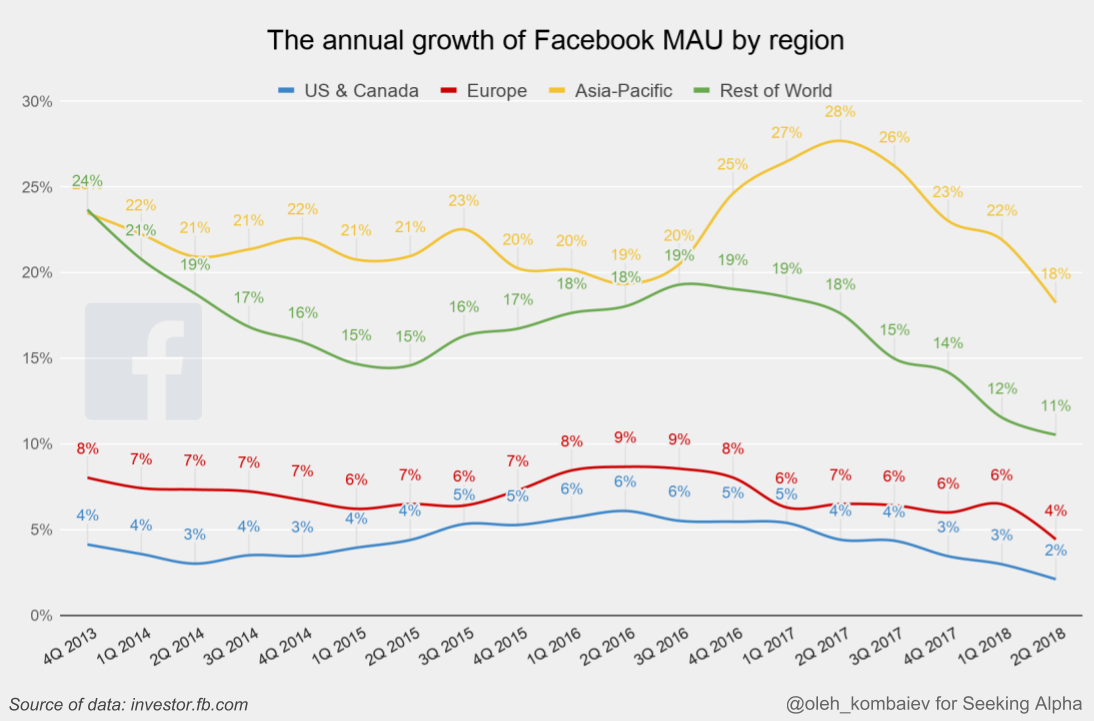
The most alarming is the fact that the growth rate most substantially slows in the United States and Canada. And these are the most profitable segments of the company:
Now let’s look at the Advertising Revenue per User:
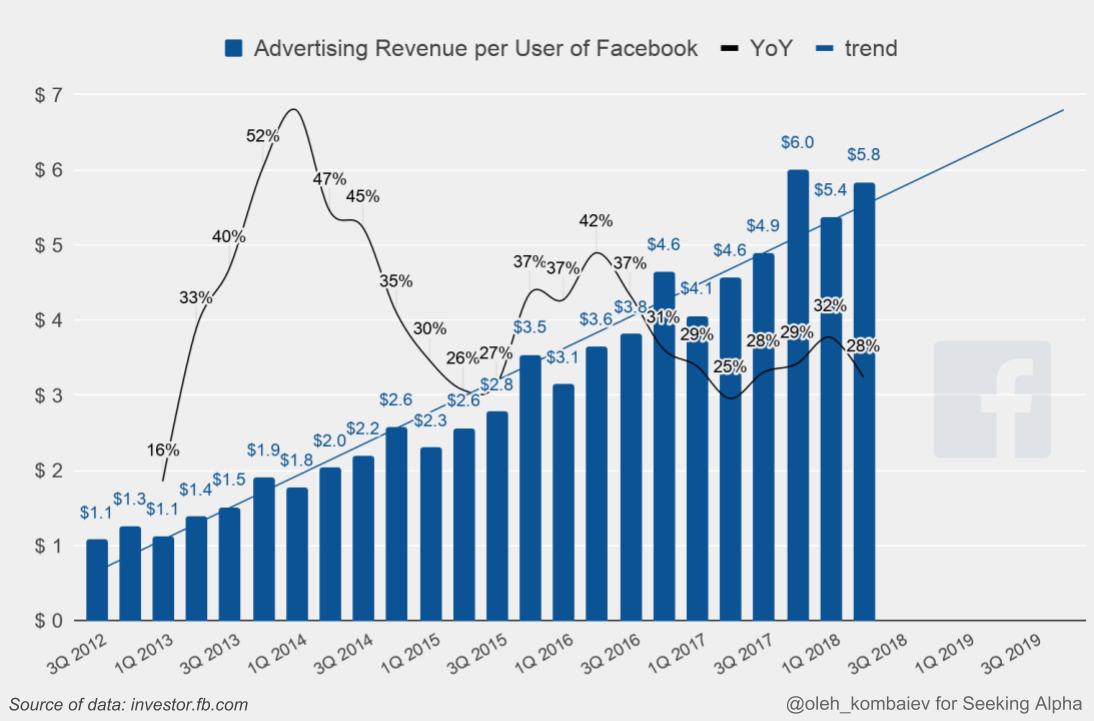
As you can see, there are still no signs of slowing growth, and by the end of the year, this figure will surely exceed $6. Although, common sense suggests that this process cannot continue forever. But do we understand correctly the meaning of this indicator?
Here"s what Facebook’s last quarterly 10-Q says about calculating ARPU and MAU:
The numbers of DAUs and MAUs discussed in this Quarterly Report on Form 10-Q, as well as ARPU, do not include Instagram, WhatsApp, or Oculus users unless they would otherwise qualify as such users, respectively, based on their other activities on Facebook. In addition, other user engagement metrics included herein do not include Instagram, WhatsApp, or Oculus unless otherwise specifically stated.
Source: 10-Q p. 4
And here is what it says about advertising revenue:
Advertising revenue is generated by displaying ad products on Facebook, Instagram, Messenger, and third-party affiliated websites or mobile applications.
Source: 10-Q p. 12
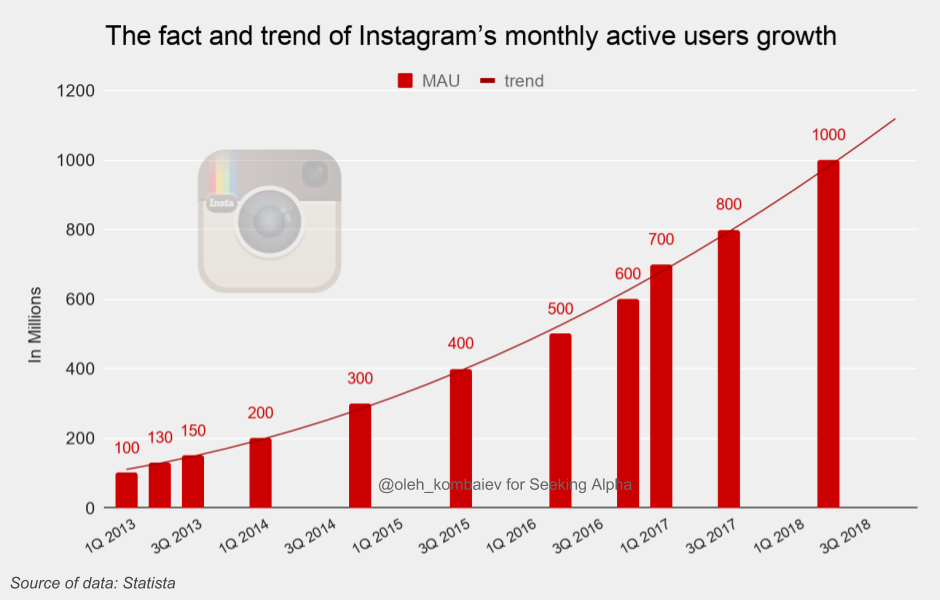
So, speaking about the real size of Facebook’s audience, we should not forget that, in addition to the audience of the social network itself, we should also add the audience of Instagram that has already exceeded 1 billion users:
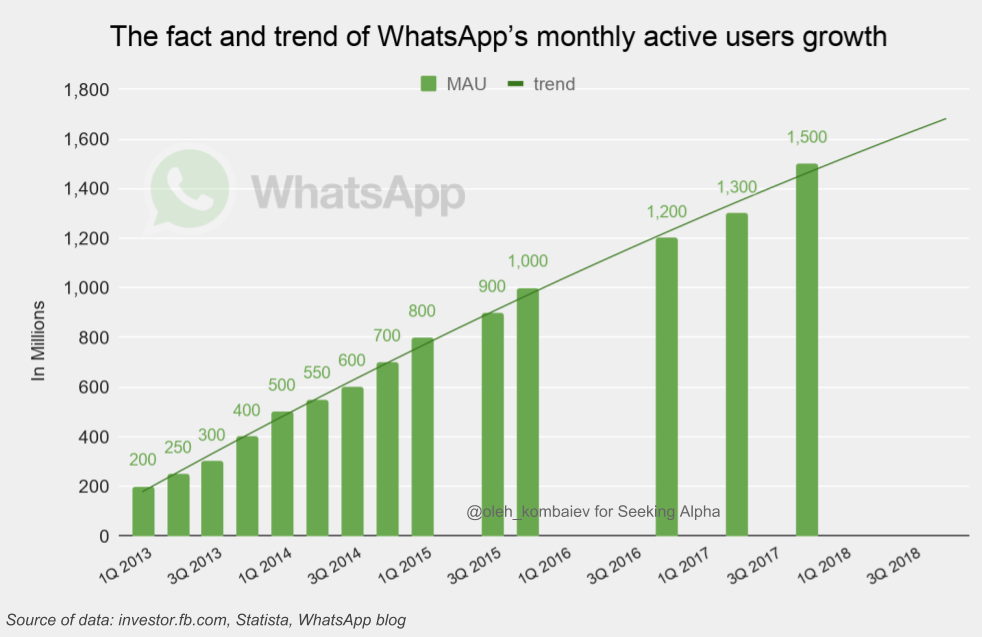
We should also take into account the audience of WhatsApp Messenger that judging from the trend is already reaching 1.6 billion:
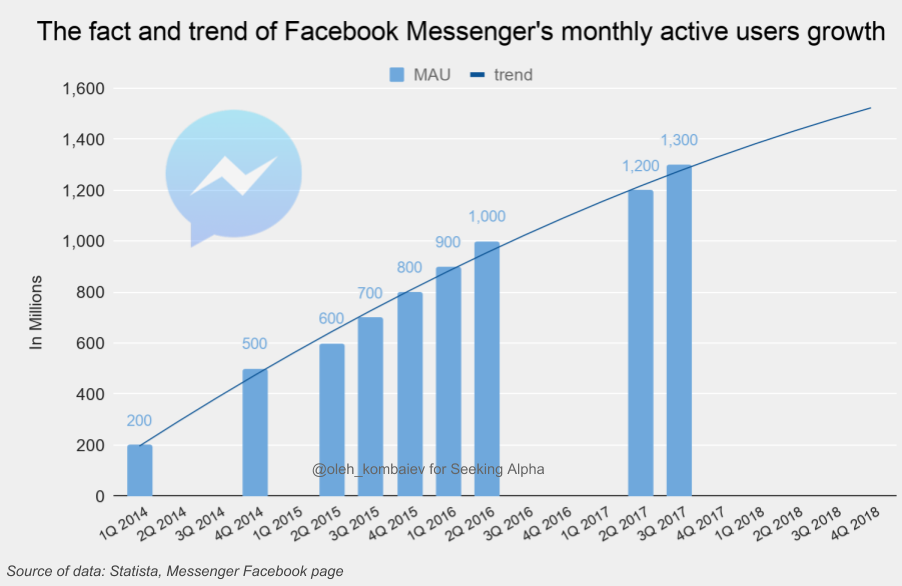
And, I think we should add the audience of Facebook Messenger, that probably already exceeds 1.4 billion:
So, it turns out that the real size of Facebook’s audience is about 6.2 billion. Of course, these are more or less the same users. But it"s not important in the world of multitasking we live today.
Now, if we recalculate the average advertising revenue per user, we’ll get only $2.1. Given that the management has started to monetize Facebook Messenger relatively recently, and has not even started to monetize WhatsApp, I believe that Facebook’s revenue has even more growth potential. If in the horizon of the next 10 years the average revenue per user of Facebook + Instagram + WhatsApp + Messenger combined reaches $6, we’ll get annual revenue at the level of ~$150 billion. And this is assuming that the overall audience size will remain at the current level.
Therefore, the baseline scenario of my DCF-valuation suggests that in the next 10 years the annual revenue of Facebook will reach $150 billion:
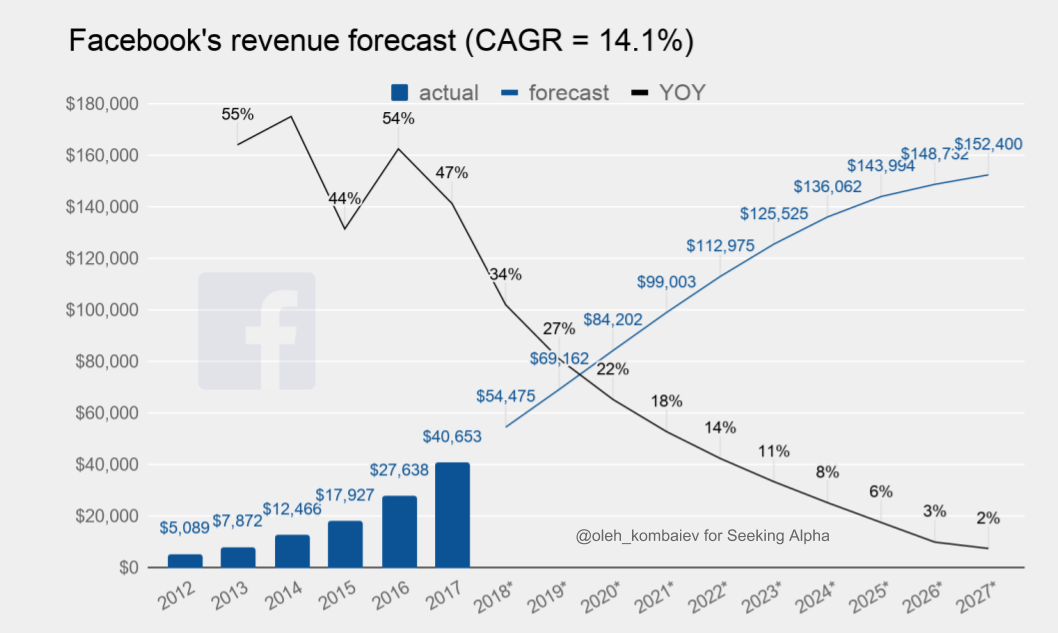
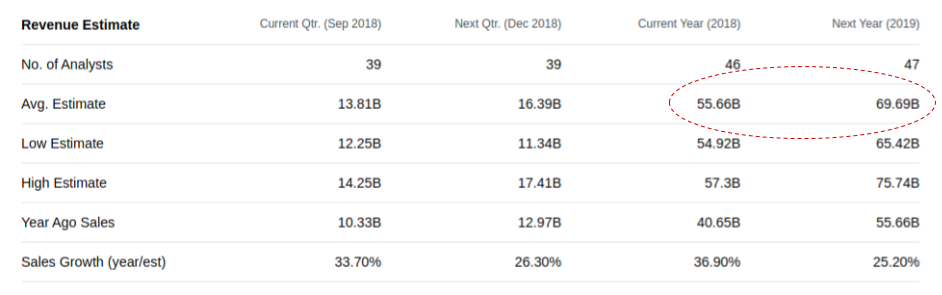
I would like to draw attention to the fact that my forecast assumes Facebook’s revenue of $54 billion in 2018 and $69 billion in 2019. Both figures are below current average analyst expectations:
Moving on to the Weighted Average Cost Of Capital (WACC) of Facebook:
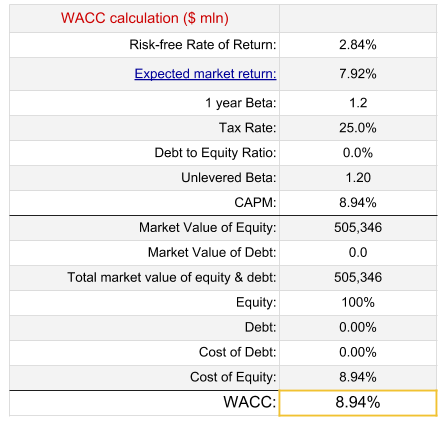
To calculate the WACC, I used a one-year rolling beta coefficient, which is close to the absolute historical peak:
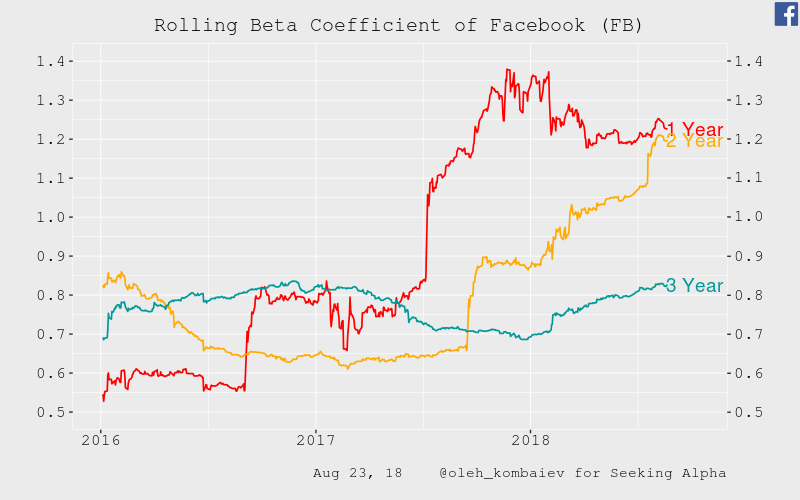
I would like to mention that if I had used the value of three-year rolling beta coefficient, the WACC would significantly decrease, and Facebook’s stock growth potential within this model would be unbelievably high.
Directly in the model itself, I relied on the following assumptions:
1. The average tax rate is 25%.
2. In the future, the beta coefficient will drop from its current highs, which would entail lowering of the WACC.
3. Operating margin for Facebook for the next 10 years will gradually reduce from 42% to a more adequate 23%.
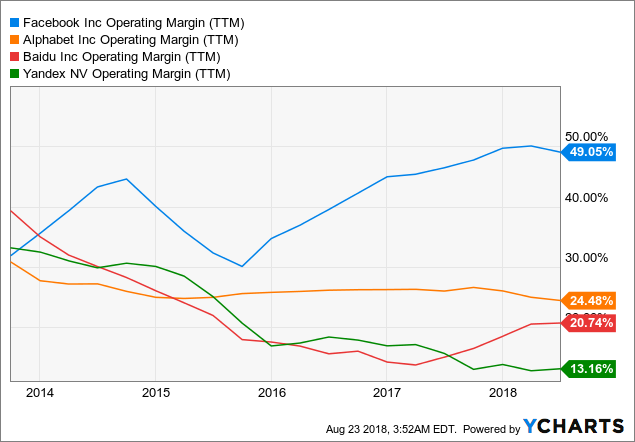
FB Operating Margin (TTM) data by YCharts
4. Facebook’s CAPEX is expected hit $15 billion this year, which is approximately 28% of the annual revenue. However, in the future, I believe this figure will be reduced to 14%.
We anticipate making capital expenditures in 2018 of approximately $15.0 billion.
Source: 10-Q p. 24
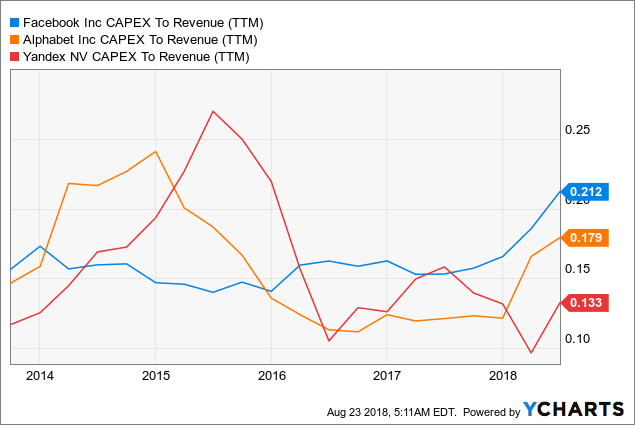
FB CAPEX To Revenue (TTM) data by YCharts
So, here"s the model itself:
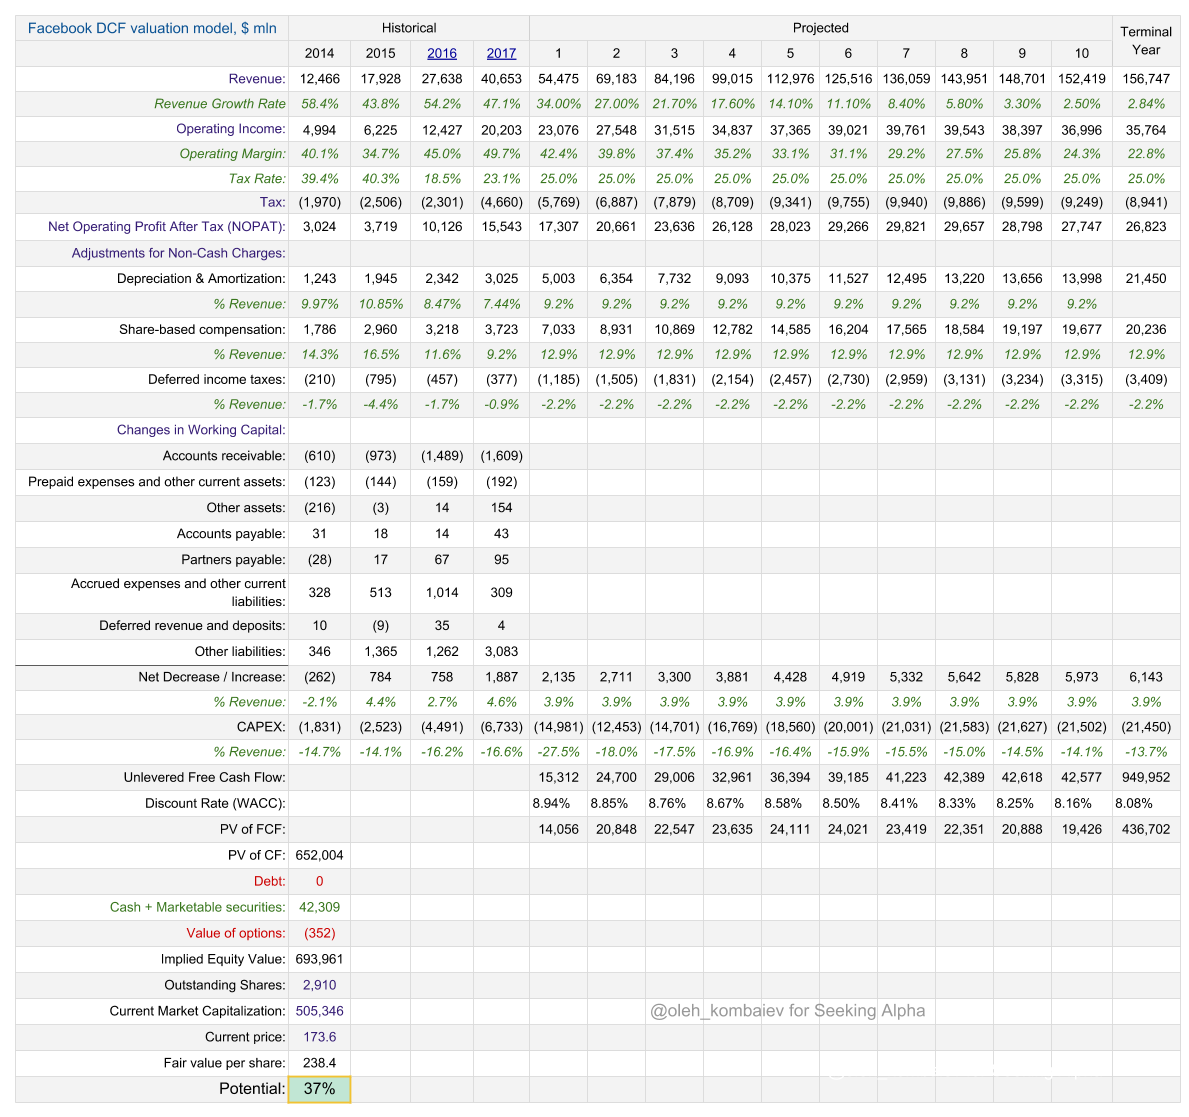
The DCF-based target price of Facebook"s shares is $238, offering ~37% upside.
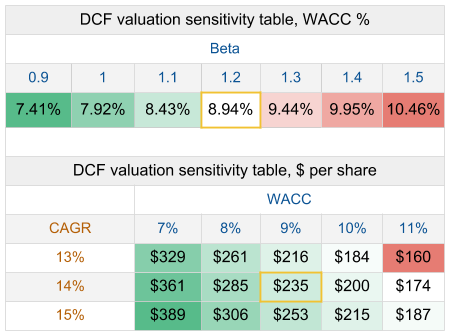
The result of the model is sensitive to the WACC, which, in turn, is very sensitive to the beta coefficient and the CAGR of the revenue.
So, I present two sensitivity tables:
Bottom Line
The result of the DCF-modeling does not require additional interpretation. Facebook is undervalued by at least 40%.
But if we use the three-year beta coefficient in the calculations, the potential increases to ~100%. Which one of the coefficients to use in the DCF analysis depends on the forecast horizon.
Disclosure: I/we have no positions in any stocks mentioned, and no plans to initiate any positions within the next 72 hours.
I wrote this article myself, and it expresses my own opinions. I am not receiving compensation for it (other than from Seeking Alpha). I have no business relationship with any company whose stock is mentioned in this article.
No comments:
Post a Comment