The Dow Jones Industrial Average set an all-time intraday high of 26,215.23 on Monday, Jan. 22 up 6% year to date, as General Electric (GE) set a multiyear intraday low of $15.80, down 7.3% year to date and mired in bear market territory down 47.1% since setting its 52-week high of $30.59 on Feb. 21, 2017.
GE reports quarterly earnings before the opening bell on Wednesday, Jan. 24 and analysts expect the company to earn 28 cents a share.
Some say that GE is now a buy on the prospect of successfully transitioning into an industrial stock. In my opinion, a trading position at my monthly value level of $15.92 can be justified given that the stock is technically oversold.
However, if GE spins off business units, the stock will likely be booted from the Dow Jones Industrial Average, which normally causes weakness, as any portfolio benchmarked to the Dow 30 must remove the stock.
Bank of America Merrill Lynch downgraded the stock citing lower earnings estimates, a lack of value for GE Capital and a $6.2 billion after-tax charge for its insurance portfolio.
I must admit that I liked shares of GE when the dividend yield was above 4%, but when the dividend was cut, and the yield fell below 3%, I would not even include the stock in my eight ‘Dogs of the Dow’ for 2018.
Most analysts who track the Dogs of the Dow’ have ten components. I have been choosing eight stocks, and each year I remove the prior year big winners. I want to have my dog pound to have an aggregate loss for the prior year, but that was illusive for 2018. My eight ended 2017 with an aggregate gain of just 1.7%.
The daily chart for GE
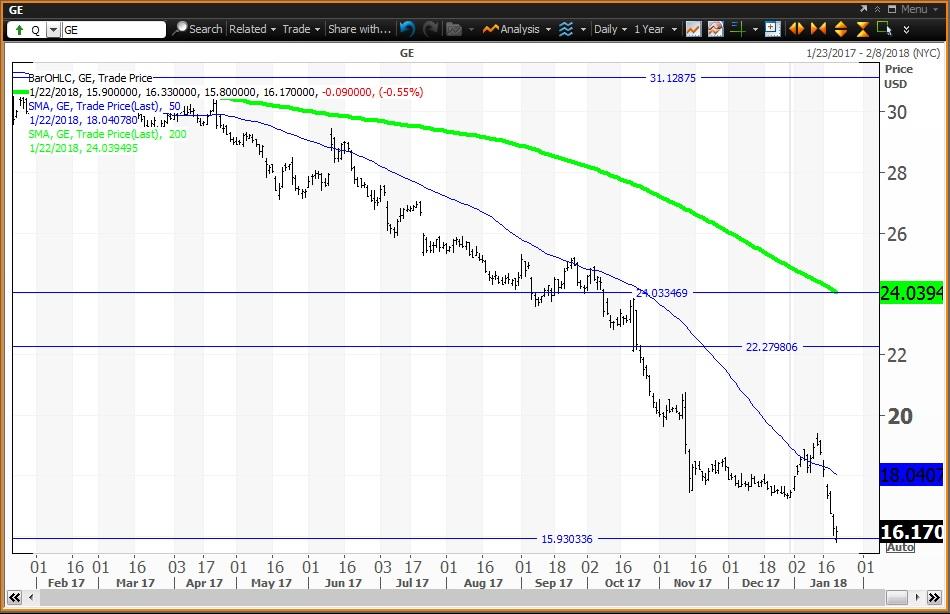
Courtesy of MetaStock Xenith
The daily chart shows that GE has been below a ‘death cross’ since March 8 when the stock closed at $29.80. A ‘death cross’ occurs when the 50-day simple moving average falls below the 200-day simple moving average indicating the lower prices lie ahead.
The horizontal lines show my monthly value level of $15.92, my quarterly risky level of $22.27, my semiannual risky level of $24.03 and my annual risky level of $31.12.
The Weekly Chart for General Electric
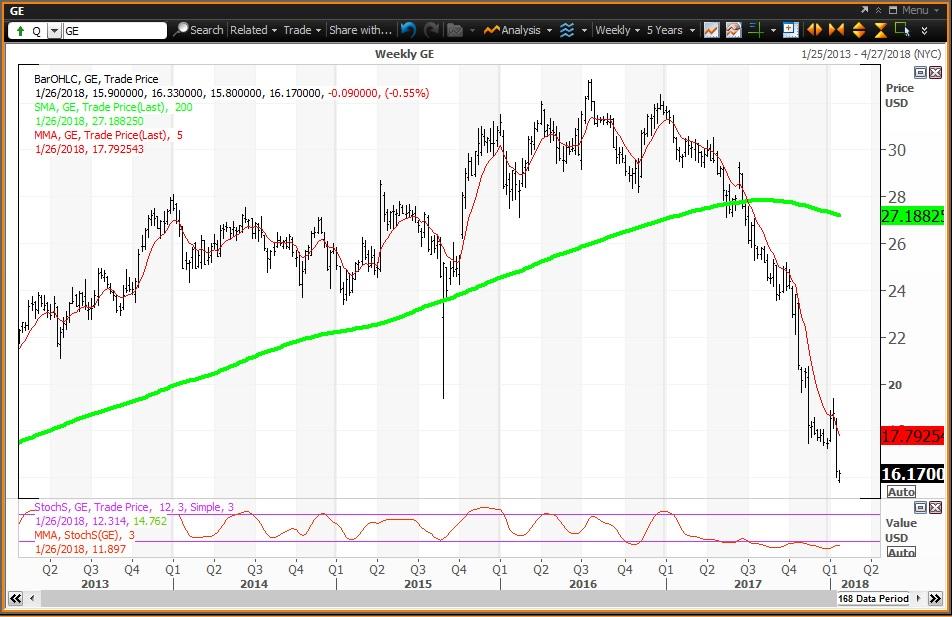
Courtesy of MetaStock Xenith
The weekly chart for General Electric is negative but oversold with the stock below its five-week modified moving average at $17.79. The stock is well below its 200-week simple moving average or ‘reversion to the mean’ at $27.19, last tested during the week of June 23 when the average was $27.77. The 12x3x3 weekly slow stochastic reading is projected to end this week at 11.90 well below the oversold threshold of 20.00.
Trading Strategy: Buy weakness to my monthly value level of $15.93, and reduce holdings on strength to my quarterly and semiannual risky levels of $22.27 and $24.03, respectively.
Disclosure: I/we have no positions in any stocks mentioned, and no plans to initiate any positions within the next 72 hours.
I wrote this article myself, and it expresses my own opinions. I am not receiving compensation for it (other than from Seeking Alpha). I have no business relationship with any company whose stock is mentioned in this article.
No comments:
Post a Comment