Don’t Get Used To This Melt-up, Stocks Could Reverse At Any Moment
Stocks continue their relentless rise; equities seem like they are unstoppable, bulletproof even, some would say. The SPDR S&P 500 ETF (SPY) has gained 8% so far just this year. And the S&P is not alone, the Nasdaq 100 (QQQ) has surged by 10%, and the DJIA (DIA) has increased by 8% this year as well. All this bullish action in just the first 4 weeks of trading, as equities embark on their best start to a year in decades.
However, it"s not all good news. In fact, some troubling developments are clearly beginning to emerge. For instance, one noticeable laggard has been the Russell 2000 (IWM), as the small cap index has distinctly underperformed major indexes, and is only up by 3% thus far this year.
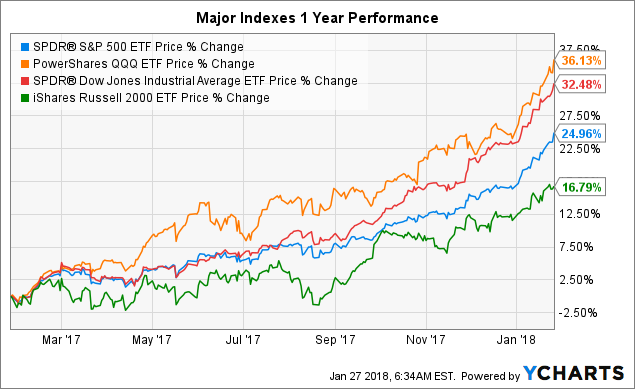
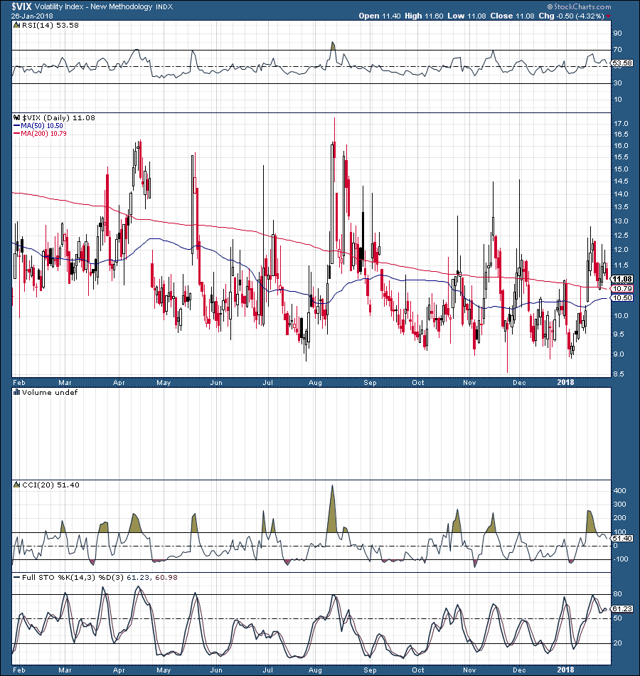
Despite the advance in equities, several other troubling developments have become more apparent. The dollar has been selling off for over a year, but now bonds are being sold off too. Also, the VIX has been behaving atypically, as the “fear gage” usually moves contrary to stocks. Conversely, the VIX had shot up by 33% year to date in recent days, while stocks were at or near all-time highs. Such abnormal moves in the VIX have been linked as precursors to heightened periods of volatility. To top things off, there are clear signs of heightened inflation in the U.S., coupled with the FED’s embankment on an aggressive tightening path.
There is no denying it, clearly there are some favorable fundamental elements concerning stocks, and these factors continuously get accentuated throughout the news and financial commentary. However, there are also a mounting number of concerning factors that often get overlooked, and appear to be perpetually underreported. Essentially, the fundamental cracks beneath the stock market’s surface are beginning to form, and as they start to fracture, the current stock market melt up may very well turn into a market meltdown, fast.
About SPY
SPY is the first major and most popular ETF in the world. It’s designed to mimic the exact movement of the S&P 500. The SPY Index fund has roughly $277 billion in net assets, and each share in the fund represents a fraction of the holdings. SPY provides investors with exposure to the S&P 500 index, which is widely regarded as the most significant stock market average for U.S. equities. Since SPY tracks the exact movements of the S&P 500 I will use SPY and the S&P 500 interchangeably throughout the article.
Let’s Start by Identifying the Positives
Welcome to the calmest stock market in history. The S&P 500 surpassed its former record of going the most number of days without a 3% correction all the way back in November 2017. More recently, the S&P passed a more significant milestone. The world’s most widely watched stock market average has gone 400 trading days without a 5% correction, now the longest stretch in history.
There are various elements that enabled stocks to continuously move higher over the past several years. The U.S. has seen increased economic activity, and the FED has been very supportive of stocks for a long time. This has led to an increase in corporate profits, and the introduction of tax cuts and other constructive elements have helped to boost optimism and overall market sentiment. However, these economic developments have been highly publicized and are largely priced into stocks, perhaps even overpriced in by some accounts.
Other Crucial Developments for Stocks
What is far less advertised and often dismissed in the media are the troubling economic developments surrounding stocks. Despite the market’s perpetual climb, rising inflation, a tightening FED, a simultaneous dollar and bond market selloff, small cap underperformance, a VIX divergence, extreme overbought conditions, amongst other elements, are all screaming that something is wrong. Optimism appears to be too high, and no one wants to pay any attention to these clear warning signals. Perhaps market participants believe that no matter how high this wall of worry grows the FED juiced bull will have no trouble climbing it anyways.
Well, many market participants will be in for a rude awakening, because nothing lasts for ever, and all good things come to an end. Just as sure as the sun is to rise every morning, this bull market will come to an abrupt end one day, and judging by the screaming warning signals surrounding stocks that day may be a lot closer than many perceive.
Inflation: It"s All Around Us
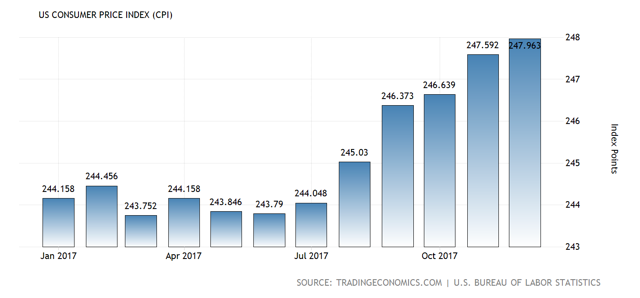
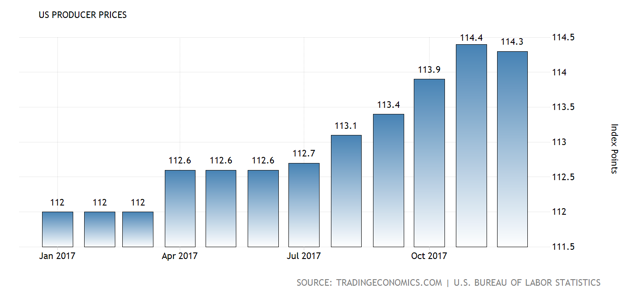
Everywhere you look there is inflation, the latest CPI came in above 2%, the PPI is trending above 2.5%, with final demand goods coming in at 3.5% and trending well above 3% throughout the last year. Crude oil is on its way to $70, and likely $80, and maybe even $100 before year’s end. Gold is nearing multiyear highs and will likely break out in the very near future. Prices just about everywhere are rising. So, a logical question emerges, how much can the economy take?
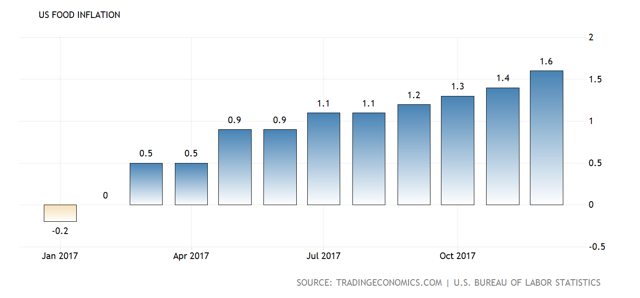
Higher food and energy costs are likely to impact consumer purchasing power going forward. This is especially true because wage growth has been slower than anticipated in recent months and years for that matter.
Also, the disconnect between the CCI and the PPI suggests that companies are paying higher prices for raw materials to create products, but are not passing on the increased costs to consumers, yet. Since they are in a sense eating the costs right now, this should translate into compressed margins and thus lower corporate profits going forward. Once companies do pass on the extra costs to consumers this will take away from consumers’ purchasing power. Either way, inflation without robust wage growth is a net negative for the economy and stocks in general.
FED Tightening: May Cause More Harm Than Good
To compound the issue, the FED has embarked on a relatively aggressive tightening campaign. The Federal Reserve raised rates 3 times last year and is looking to increase interest rates an additional 3-4 times this year as well. Undoubtedly higher rates will make borrowing costlier and more difficult. Moreover, corporations will pay higher interest to service existing debt, which is already at record levels. This phenomenon will decrease economic activity and will put additional pressure on already stretched corporate margins and balance sheets, ultimately impacting their bottom lines.
Bond & Dollar Selloff
Numerous market participants have expressed concern about the recent bond market selloff. Moreover, it is likely to get worse since the FED has begun to unwind its massive balance sheet, and China basically stated that it is no longer interested in buying U.S. debt. The most troubling fact is that China is the U.S.’s biggest creditor, and if they are not buying they may as well be selling U.S. bonds.
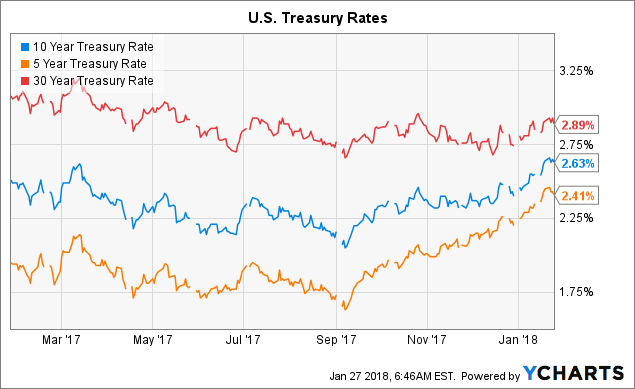
The noticeable flattening of the yield curve is also concerning as investors get very little incentive to own longer term treasures.
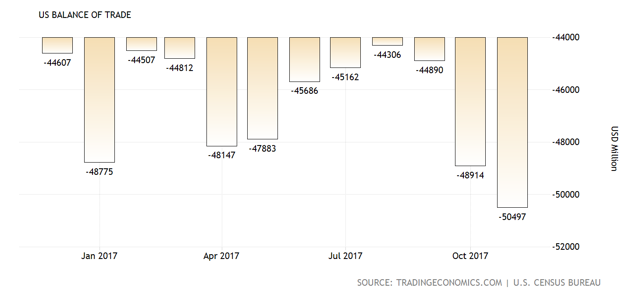
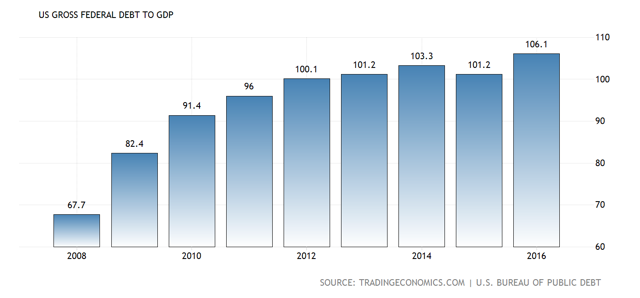
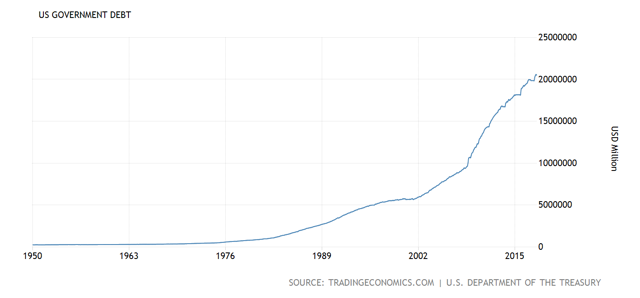
In addition to the FED and China fueled bond selling, the perpetually falling dollar is fueling the selloff in bonds. Many market participants don’t want to own U.S. debt at this low yield with a declining dollar. The dollar is already down by well over 10% in the last year and shows no signs of slowing down its decay, as it recently blew past key resistance. Also, the dollar is unlikely to regain its long-term composure any time soon as the U.S.’s widening trade deficit, expanding government debt, and inflationary pressures should continue to suppress the USD going forward.
USD 1-Year Chart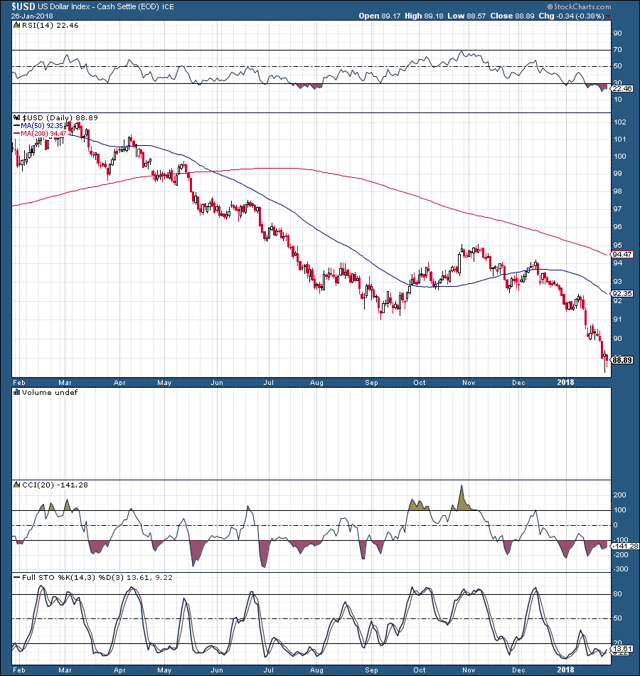
Source: Stockcharts.com
The dollar is essentially melting away, breaking through key support to the downside. There was a brief blip when President Trump attempted to talk the dollar up but that proved to be a very transient pop. It is going to be very difficult to talk up the dollar when there are so many negative elements stacked up against it. Also, if we look at a longer term chart we can see that the dollar can fall significantly further. Moreover, there isn"t much support left to stop it from cascading lower.
USD 5-Year Chart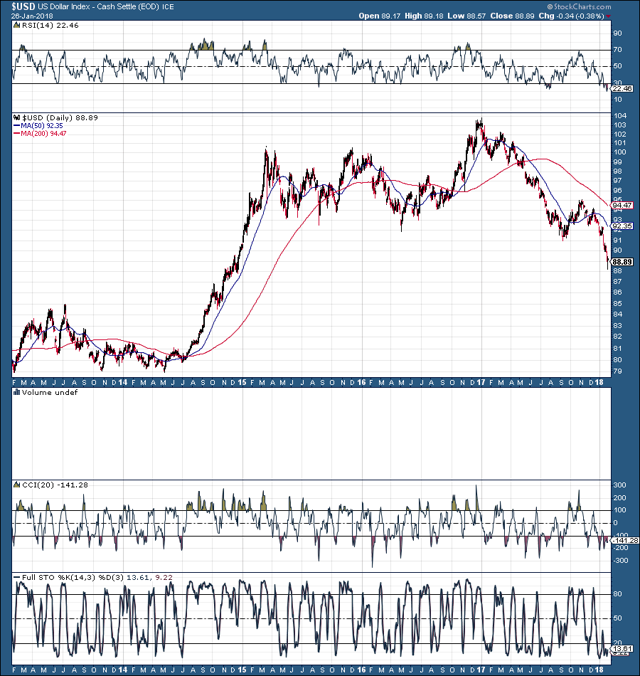
Therefore, the FED may have to raise rates even more than anticipated to create additional incentive for outside parties to own U.S. bonds. This would however impact other aspects of the economy negatively, including stocks.
Small Cap Underperformance
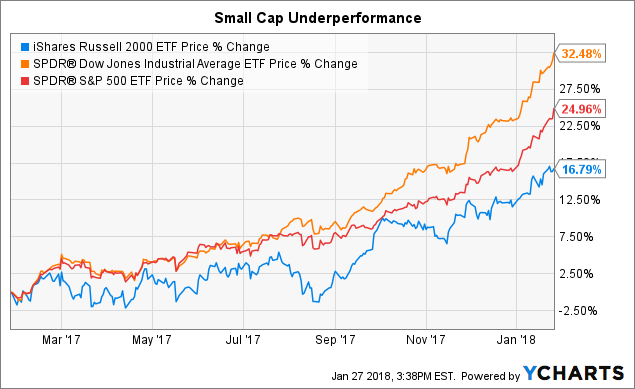
Another warning sign is the small cap relative underperformance in relation to other major market indexes. Whereas SPY is up by 8% and the Nasdaq is higher by more than 10% this year, the Russell 2000 is only up by about 3%. The Russell’s underperformance goes out a lot further, as the small cap index is up by 16% over the last year, while the S&P is by nearly 25%, and the Dow is up by over 32%. The fact that large cap stocks have outperformed small cap stocks by roughly 50% in the last year is not an encouraging signal. Typically, in a strong rally you want to see small caps outperforming, not the other way around. The Russell’s underperformance could be perceived as a late stage bull market cycle phenomenon in which large caps begin to outperform small cap stocks before a market top.
The VIX Divergence
The VIX has surged in conjunction with stocks this year. Despite the significant gains in SPY and other stock indexes the VIX was up by as much as 33% year to date in recent days. This suggests that market participants are becoming increasingly concerned with current stock prices and valuations, and are purchasing options protection to hedge their long stock positions. This phenomenon has often led to short term tops in recent years, and suggests that a stock market correction is likely to occur in the near future.
VIX 1-Year Chart
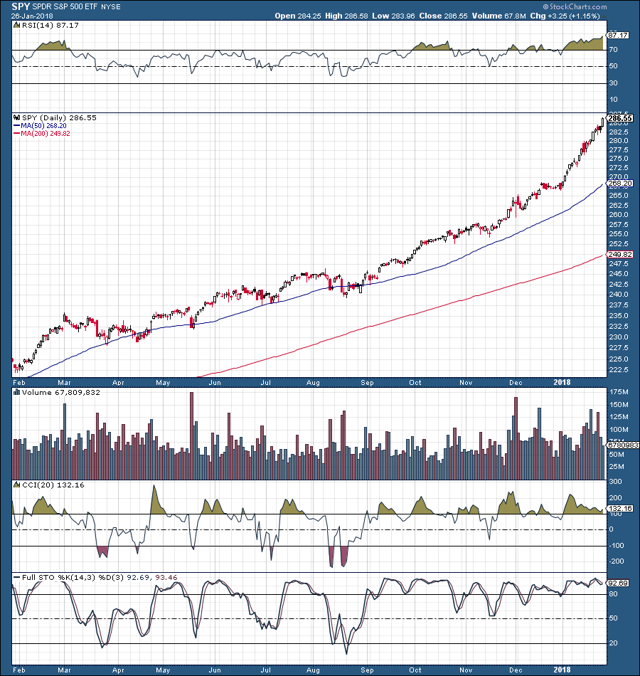
From a technical point of view, SPY has gone completely vertical, and is the most overbought it has been in at least 5 years, judging by the charts. However, I am convinced SPY has not been this overbought on a short term basis going back much further. We would likely have to go back to the late 90s to find a stretch of time where stocks are as overextended as they are now.
The RSI is now at an unprecedented 87, and has been decisively above 70 for about 5 weeks now. Moreover, SPY is now about 8% above its 50-day moving average, and 15% above its 200-day moving average, showing once again that stocks are extremely overextended. The full stochastic has been above 50 since late August, and the list goes on. Essentially, all known technical indicators are screaming that stocks are extremely overbought right now and could at the very least use a healthy correction.
SPY 1-Year Chart
The Bottom Line: Protect Your Portfolio and Get Ready to Buy the Dip
Despite all the underlying evidence suggesting that stocks are overbought, coupled with the troubling economic developments, I cannot simply say “get out now”. In fact, I am continuing to hold my long stock positions. Predicting a precise market top is simply too difficult, and stocks could become much more overextended before a meaningful decline occurs. However, on the flipside a significant selloff could begin tomorrow, or the next day, or the day after that.
So, I want to protect my portfolio against a potential downturn. My strategy is to diversify, go international, buy commodities, oil, and gold stocks. I also want to have some cash on hand to buy the dip when the opportunity presents itself. A healthy 5-10% correction would recalibrate valuations, shake out the weak hands, and create significant buying interest capable of taking stocks to new all-time highs.
However, another possible element to consider is that we are now entering the tenth year of this expansionary cycle for stocks. This is now the second longest running bull market on record, not far behind the dotcom bubble of the 1990s. So, it is logical that a significant downturn is likely to occur in the not so distant future. Do I expect a bear market to begin this year? No. Do I expect one to start in 2019 or 2020? Yes, given the overwhelming amount of mounting evidence and historical precedent, this seems like a distinct possibility.
For 2018 my favorite sectors are financials, big tech, energy, metals, defense, big cap China tech, and other select international names.
Just because the 1987 crash was a long time ago doesn"t mean we can"t see something similar occur, some time relatively soon!
Disclaimer: This article expresses solely my opinions, is produced for informational purposes only, and is not a recommendation to buy or sell any securities. Investing comes with risk to loss of principal. Please always conduct your own research and consider your investment decisions very carefully.
To receive real time updates, and get more information about this idea as well as other topics we discuss visit our Albright Investment Group trading community. Join us and receive access to exclusive content, trade triggers, trading strategies, price action alerts, and price targets. The value adding features are available to members of our community and are not discussed in public articles.
Disclosure: I/we have no positions in any stocks mentioned, and no plans to initiate any positions within the next 72 hours.
I wrote this article myself, and it expresses my own opinions. I am not receiving compensation for it (other than from Seeking Alpha). I have no business relationship with any company whose stock is mentioned in this article.





No comments:
Post a Comment