Looking for bargain basement deals in the high-yield space?
Take a gander at these performance figures for Summit Midstream Partners LP (SMLP), a company whose price/unit has been seriously pressured over the past year and year-to-date, greatly underperforming the benchmark Alerian MLP Index ETF (AMLP) and the S&P 500.
SMLP had been up in the low $20s as recently as February "18, but then drifted down into the mid to low teen region, after its Q4 "17 earnings report. Over the last trading quarter, it has started to come back - it"s up 14.18%:
What Happened?
SMLP"s Q4 "17 report showed flat revenues and EBITDA, with distributable cash flow - DCF - declining for the third straight quarter, while net income had a big -230% drop.
The Q1 "18 earnings report in early May had a bigger decline in DCF and Net Income, while revenues also fell -13.61%, and EBITDA was slightly down, year-over-year.
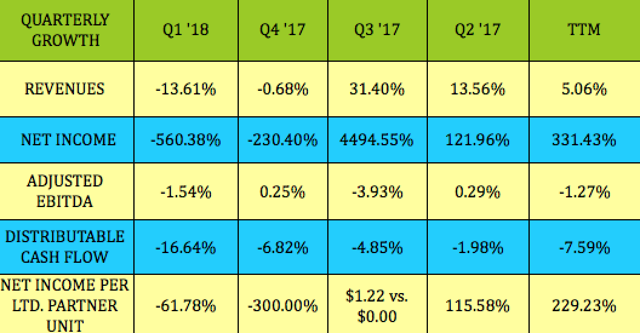
Sequentially, SMLP"s Q1 "18 earnings figures didn"t bring much joy either, with revenue, EBITDA, and DCF all down vs. Q4 "17. EBITDA and DCF also were down vs. Q3 and Q2 "17. Net income was a smaller loss in Q1 "18 than Q4 "17, but declined vs. Q3 and Q2 "17:
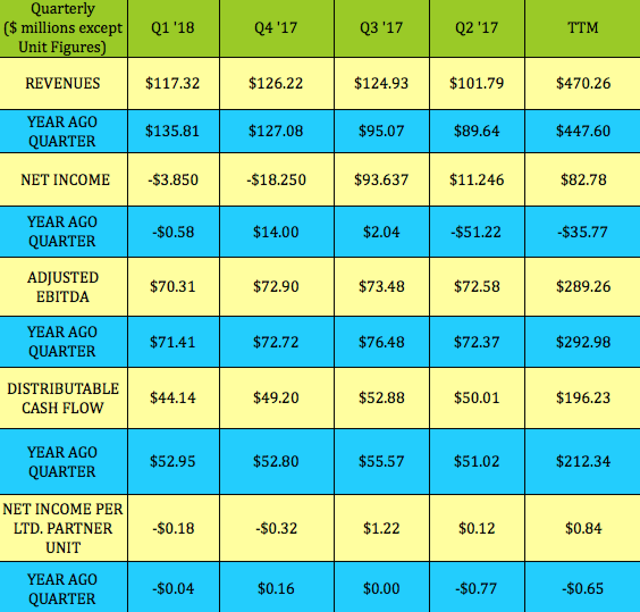
As income investors, we concentrate on EBITDA and DCF to gauge distribution and debt sustainability, since net income for infrastructure-intensive companies is usually loaded with non-cash depreciation and amortization.
In SMLP"s case, there"s another non-cash charge which throws a monkey wrench into the net income calculation - the present value of an estimated Deferred Purchase Price Obligation ("DPPO"), for a dropdown asset SMLP purchased from its sponsor in 2016. Q1 "18 included $21.7M of non-cash DPPO expense, vs. $20.9M in Q1 "17.
SMLP"s DCF faces another challenge in 2018 - they issued a $300M 9.50% Series A preferred equity transaction in the fourth quarter of 2017, so those preferred distributions get deducted from the DCF for the common units. This was $7.125M in Q1 "18. That preferred payment lowered the common DCF from ~$51M to $45M - without it, SMLP"s common unit coverage would"ve been ~1.13X.
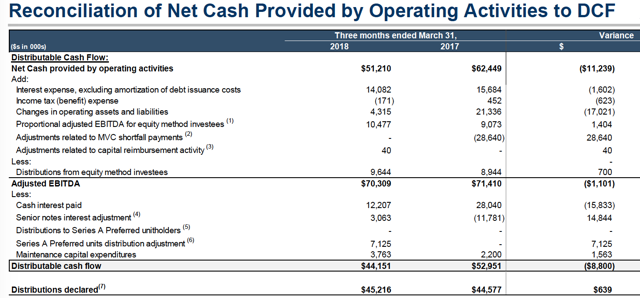
(Source: SMLP site)
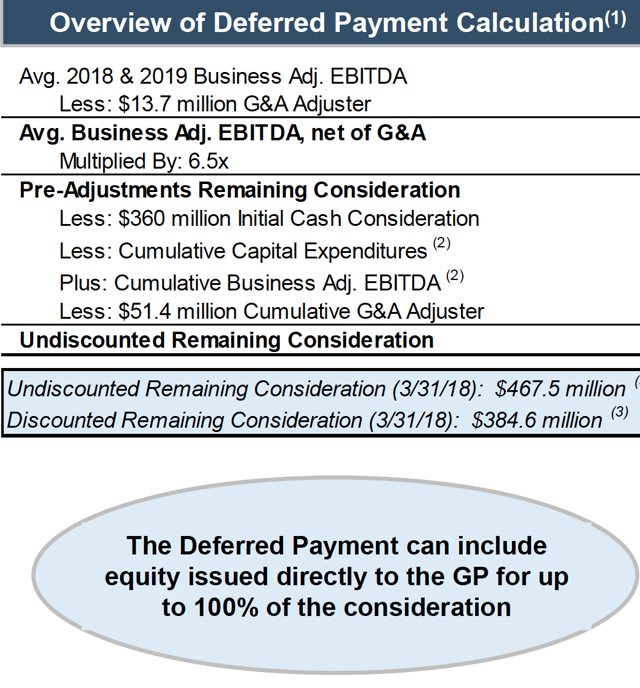
SMLP has two years remaining on this DPPO plan - the final payment comes due in March 2020. In 2018 and 2019, the DPPO will be calculated at a rate of 6.5X the adjusted EBITDA generated by the asset. These are the other adjustments used in this calculation, which came out to an undiscounted value of $467.5M, and a discounted value of $384.6M, as of 3/31/18. Management discounts the estimated remaining consideration on SMLP"s balance sheet and recognizes the change in present value on its income statement.
"The Deferred Payment calculation was designed to ensure that, during the deferral period, all of the EBITDA growth and capex development risk associated with the 2016 Drop Down Assets is held by the GP, Summit Investments." Management also noted in its Q1 "18 presentation, that the remaining consideration dollar amount is "largely funded."
As listed above, SMLP can issue SMLP units to pay 100% of the consideration, but clearly, they intend to avoid a major dilution in paying off this deal, as their most recent presentation stated that "the Deferred Payment consideration mix of debt and equity will target the following pro forma metrics: 4.0x leverage and ?1.20x distribution coverage." That"s good, since they"d have to issue ~25M units at SMLP"s current price to fund it via equity alone, which would amount to ~34% of the current float.
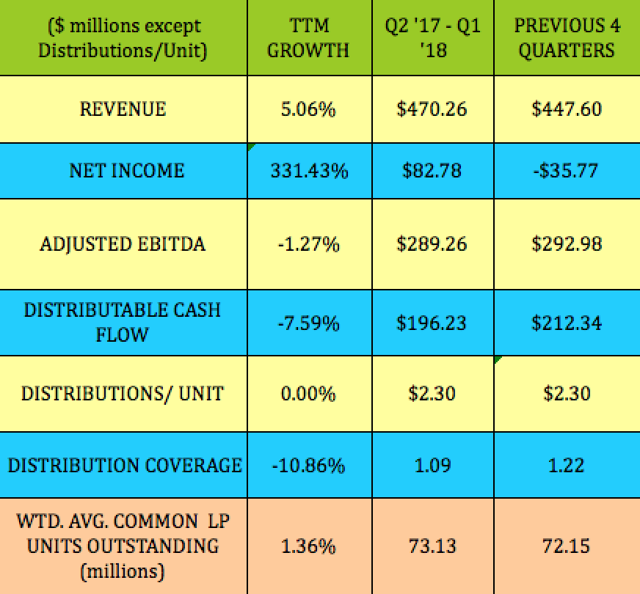
SMLP"s unit count was pretty stable over the past four quarters, only rising 1.36%. Management has kept the quarterly distribution at $0.575 since November 2015. However, with DCF declining by -7.59%, distribution coverage also fell by -10.86%:
Distributions:
Like many of the LPs we"ve covered, SMLP pays in a Feb-May-Aug-Nov. cycle. Unit holders receive a K-1 at tax time. You can track SMLP"s current price and yield in our High Dividend Stocks By Sector Tables, (in the Basic Materials section).
At $15.30, SMLP yields 15.03%, with trailing coverage of 1.09X. Its current $.575 quarterly payout is 100% above its targeted minimum quarterly distribution.

As we noted above, SMLP has had declining DCF over the past two quarters. This has resulted in lower distribution coverage - it fell below 1X in Q1 "18, to .98.
That doesn"t look promising, but is there some valid rationale for expecting management"s long-term higher distribution coverage goals to come to fruition?
In the Q1 "18 presentation, they issued EBITDA guidance of $285-300M, and a coverage range of .95-1.05X for 2018. This EBITDA range straddles SMLP"s actual 2017 figure of $290M, implying a growth range of -1.85% to 3.32%. The guidance indicates that coverage will be down by a range of -16.67% to -7.89% vs. the 1.14X coverage SMLP had in 2017:

The problem is that SMLP"s growth projects aren"t expected to contribute meaningfully to earnings until 2019. Management expects the Utica, DJ, and Delaware growth projects to contribute an EBITDA range of $33M to $54M once they"re developed.
The Double E project is being evaluated for various structures, such as a possible joint venture, with a financial decision expected in Q3 "18. There"s currently an open season for this project, and management is "currently working with a number of anchor shippers for firm capacity under long-term contracts." This is a much longer term project, and not expected to kick in until Q2 "21.
Capex:
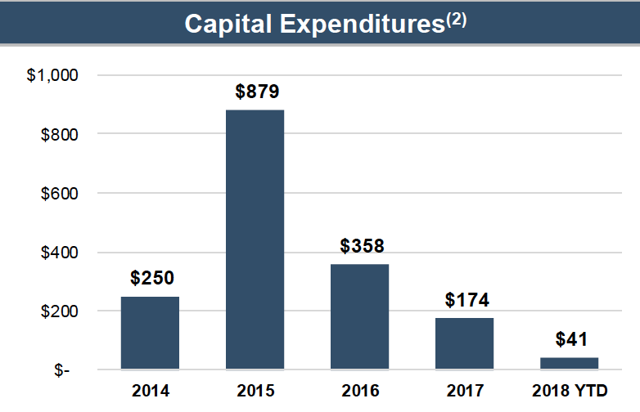
SMLP"s biggest capex spends were back in 2015 and 2016, when it spent $879M and $358M, respectively, in developing its assets. Management guided to a range of $160-205M for growth capex, and $15-20M in maintenance capex in 2018. They"re estimating that the long-term Double E project would require ~$400-450M in capex, but that this wouldn"t be spent until the current wave of growth capex has wound down.
2019 - Can SMLP Turn The Corner?
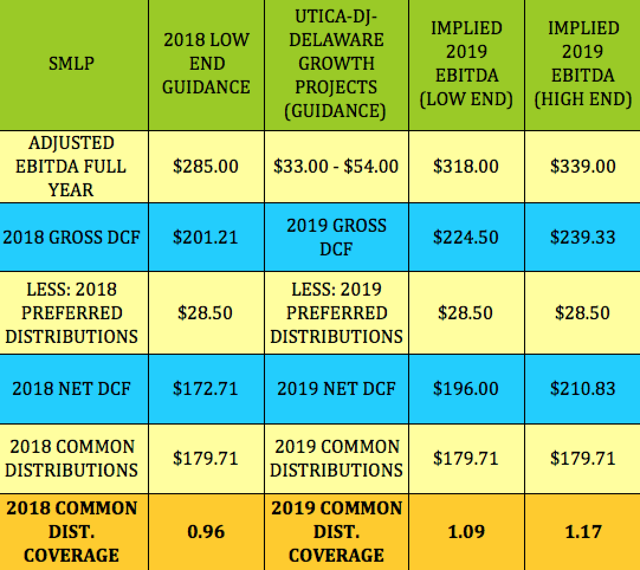
We put together the following table in order to get an approximate idea of whether SMLP can get back to better distribution coverage in 2019. This table uses management"s low end 2018 EBITDA guidance of $285M, and then adds in the high and low EBITDA ranges for its three growth projects that are supposed to earn money in 2019.
We went with the same percent ratio of DCF/EBITDA as SMLP had in 2017, in order to get a rough idea of how much DCF it can earn in 2019. We also came up with a total called "gross DCF," which is the amount of DCF before the Preferred distributions are deducted.
For 2018, assuming that distributions remain flat, the low end EBITDA guidance of $385M implies coverage of ~.96X.
Adding in the low end growth projects EBITDA of $33M to this gives us $318M, which implies that SMLP"s low end coverage for 2019 will be ~1.09X, and its high-end coverage could potentially reach ~1.17X.
These are approximate estimates, but it looks like SMLP"s distribution coverage, EBITDA, and DCF should start to improve sometime around Q1 - Q2 2019.
CEO Steve Newby was adamant about maintaining SMLP"s distribution on the Q1 "18 earnings call:
"I would like to make one thing clear, our distribution is secure and sustainable and at this time, there is no need for us to reconsider our current distribution payout. Our leverage is moderate, our CapEx is fully funded and we have visible and accretive EBITDA growth, we made a deliberate decision over the last several years to focus on accretive organic growth versus large dilutive M&A transactions."
"We understood the ramifications of this will be a slower growth profile coming out of the commodity cycle until these projects ramp-up. However, we now feel stronger than ever that this approach will be beneficial to our unit holders over the next 12 to 18 months, as organic growth kicks in our coverage expands and our balance sheet remains strong."
Options:
Hmmm, Q1 -2 "19, eh? What do you do in the meantime - especially if you"re not so patient?
If you"re mildly bullish, but also skittish, here"s an out of the cash secured put trade for SMLP - the idea is to "nibble at the edges" and get "paid to wait."
The December $12.50 put has a bid of $.55, which is a lot less than SMLP"s next two distributions total of $1.15, but it gives you a breakeven of $11.95.

If you"re more bullish, and want to be more aggressive with this strategy, the December $15.00 put is at the money, and pays much more, $1.35, a bit higher than SMLP"s next two distributions. The breakeven is $13.65, not too far from SMLP"s 52-week low of $13.10. Please note that put sellers don"t receive distributions.
You can see more details for both of these trades and over 30 other daily trades in our Cash Secured Puts Table.

SMLP"s call options aren"t currently that attractive, but you can see details for over 30 other trades in our Covered Calls Table, which updates throughout each trading day.
SMLP"s Assets:
SMLP provides natural gas, crude oil and produced water gathering services pursuant to primarily long-term and fee-based gathering and processing agreements with its customers and counterparties.
SMLP"s assets are located in five producing areas of unconventional resource basins, primarily shale formations, with a focus on the Williston, DJ, Utica, and Delaware basins. They also have assets in the Piceance and Barnett areas.
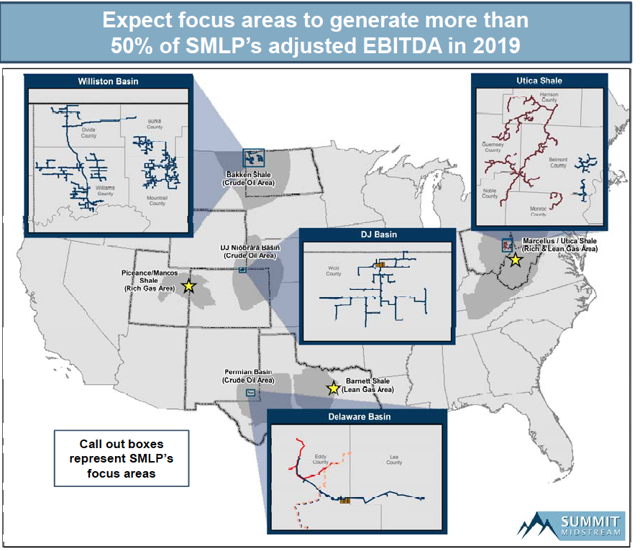
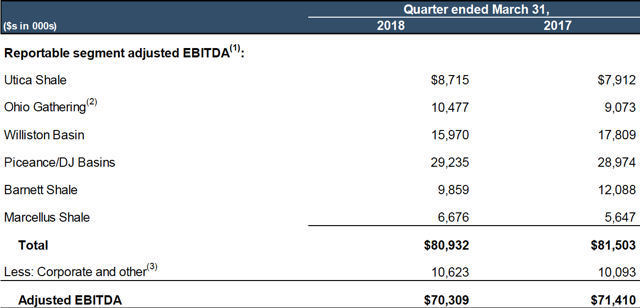
Drilling down to the segment level shows that the Piceance/DJ basin was its largest contributor to EBITDA in Q1 "18, followed by Williston, Ohio Gathering, Barnett, Utica, and Marcellus Shale.
In terms of volume, SMLP"s operating natural gas volumes averaged 1.7 billion cubic feet/day in Q1 "18, which was a 6.8% increase over Q1 "17, led by higher volume throughput in the Utica and the Marcellus.
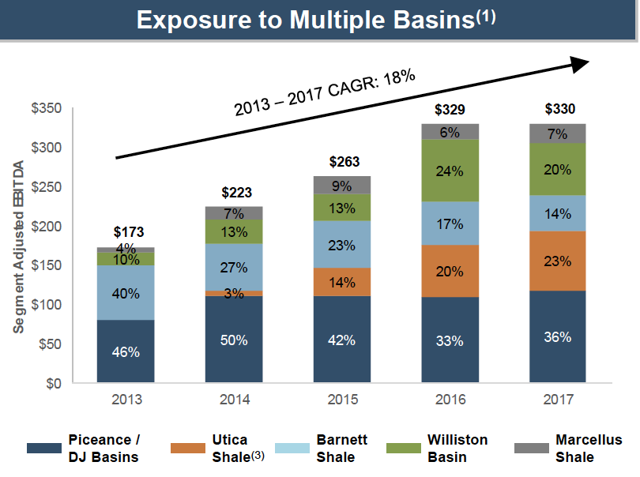
78% of SMLP"s throughput volume has come from gas-oriented drilling. The Piceance has been its biggest EBITDA-generating area, but the Utica Shale area has had the fastest growth, rising from just 3% of EBITDA in 2014, to 23% in 2017. The Williston area nearly doubled its EBITDA contribution in 2016, to 24%.
Risks:
Debt and Dilution - As with most LPs, which pay out the lion"s share of their cash flow, SMLP has to access the equity and capital markets in order to grow. They currently have an at the market - ATM - unit sales program. As you"ll see in the Financials and Debt sections below, management has de-levered the company quite a bit over the past few quarters.
Commodity Cycle - Although SMLP"s contracts are fee based, if there"s another protracted downturn in energy prices, the finishing of its customers" DUC wells inventory could be pushed out further into the future, which would pressure SMLP"s earnings.
However, SMLP does have a good defense against a downturn - Minimum Volume Commitments, or MVCs, which make up 47% of its throughput volume through 2022, as of Q1 "18. SMLP"s MVC shortfall payment mechanisms contributed $14.3 million of adjusted EBITDA in Q1 "18.
IRA"s - UBTI of over $1K/year can lead to tax complications for IRA holders. As this is a sheltered investment, you"ll get more tax sheltering advantages in a taxable account. Please consult your accountant about these issues before investing.
Analysts" Price Targets:
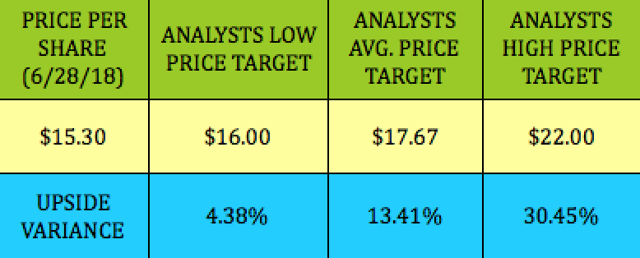
At $15.30, SMLP is 4.38% below the lowest price target of $16.00, and 13.41% beneath the $17.67 average price target.
Valuations:
In addition to having a much higher than average yield, SMLP looks much cheaper than other high yield midstream LPs we cover in our articles, particularly on a price/DCF, price/book, and EV/EBITDA basis.
Financials:
These financial comps don"t show well, in the ROA, ROE, and operating margin categories - SMLP"s operating margin got thrown out of whack in Q4 "17 by a long-lived asset impairment of $187.1M related to its Basin Midstream system in the Williston Basin segment.
However, management has made positive progress on several other fronts - ROA and ROE both improved over the past four quarters, and SMLP"s net debt/EBITDA leverage has improved substantially:
Debt and Liquidity:
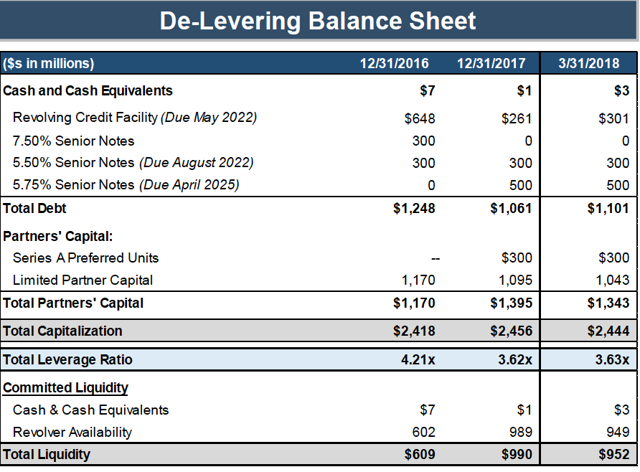
SMLP had $952M of available liquidity as of 3/31/18, with a total leverage ratio of 3.63X. With liquidity on its $1.25B revolver of $949M, the company is well capitalized.
Their debt doesn"t come due until 2022, which gives management plenty of time to refinance:
Summary:
We rate SMLP a long-term buy, based upon its ultimate growth prospects, its liquidity, and its very attractive yield. As this article"s title stated, this is one for patient investors - that promise of better distribution coverage isn"t going to come to fruition for several quarters - most likely ~Q1 - Q2 "19, so this will probably be a contrarian position for the balance of 2018.
All tables furnished by DoubleDividendStocks.com, unless otherwise noted.
Disclaimer: This article was written for informational purposes only, and is not intended as personal investment advice. Please practice due diligence before investing in any investment vehicle mentioned in this article.
Our new Marketplace service, Hidden Dividend Stocks Plus, focuses on undercovered, undervalued income vehicles, and special high yield situations.
We scour US and world markets to find solid income opportunities with dividend yields ranging from 5% to 10%-plus, backed by strong earnings.
These stocks are often small cap, low beta equities that offer stronger price protection vs. market volatility.
We publish exclusive articles each week with investing ideas for the HDS+ site that you won"t see anywhere else.
Our strategy is working in 2018 - the HDS+ portfolio is outperforming the market handily, and has an average dividend yield of over 8%.
There"s currently a 2-week Free Trial available.
Disclosure: I am/we are long SMLP.
I wrote this article myself, and it expresses my own opinions. I am not receiving compensation for it (other than from Seeking Alpha). I have no business relationship with any company whose stock is mentioned in this article.




No comments:
Post a Comment