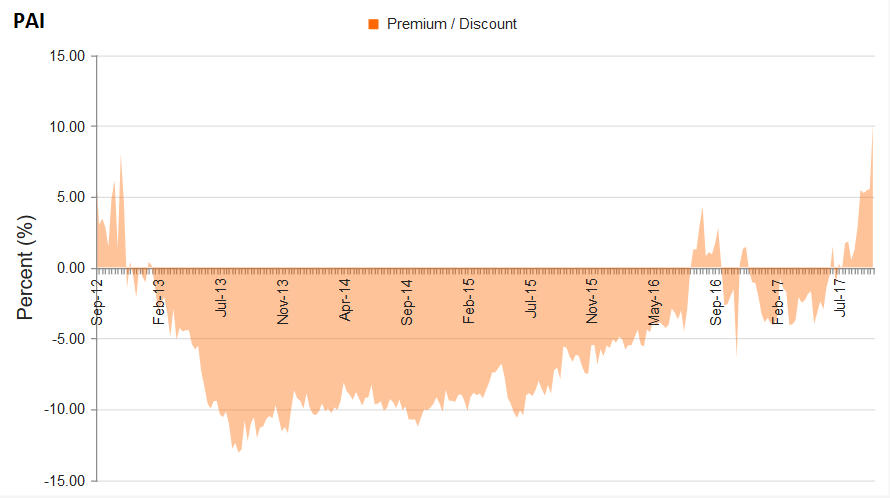
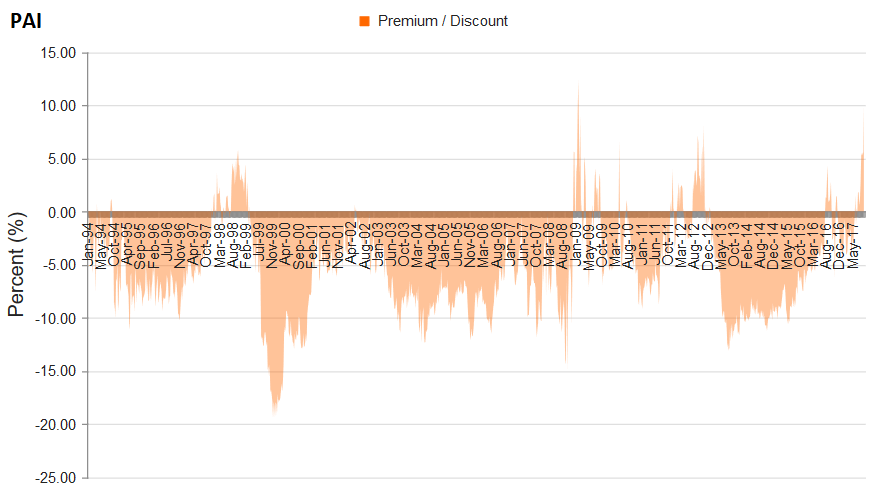
The advantage of a CEF pairs trade is that because both the sold and bought funds are from the same sector, we aren"t making a directional bet on the performance on the underlying assets. Instead, we"re simply relying on the powerful concept of reversion of CEF premium/discount values (see Reflections On Chemist"s CEF Report Pick Performance In 2017 for how this has worked well for us in the Chemist"s monthly CEF picks). There are two main limitations of the CEF arbitrage strategy. The first is that the magnitude of the gains are unlikely to be very large, simply because it is by nature a hedged strategy. That"s the trade-off for the strategy being relatively low risk. The second limitation is that unless you already own the overvalued CEF identified in the pairs trade, you would have to locate shares of the overvalued CEF to sell short. With some of the smaller, less liquid CEFs, this can range from expensive to downright impossible. The most optimal set-up is therefore already owning the overvalued CEF, and then locking in profits by selling the fund and then replacing it with the undervalued CEF in the same sector. With the introductory blurb out of the way, let"s see how this has played out for one of the more recent CEF pairs trade that we identified in the members section of the Cambridge Income Laboratory. About 4.5 months ago (see Sell This Investment Grade Income CEF Now), we noticed the premium of Western Asset Income Fund (PAI), an investment grade bond CEF, suddenly spiking up to +10.16%. The 1-year z-score was +3.6, indicating that this fund was significantly more expensive than its recent history. My comments from the initial article are reproduced below: I was looking through the CEF database today and noticed the Western Asset Income Fund (PAI) trading at an exceptionally high z-score of +3.6. Its current premium of +10.16% is at a 5-year high. A 1-year z-score of +3.6 tells us that the premium/discount is trading 3.6 standard deviations above its 1-year historical value. Statistically speaking, this would be a 0.02% probability of occurrence, assuming that the distribution of values is normally distributed (which it isn"t, but the point is that such a high z-score is a rare occurrence). The 5-year chart above showed that the fund traded at quite substantial discounts over the past 5 years, sometimes exceeding even -10%. This makes the current premium of +10.16% even more unusual than the 1-year z-score of +3.6 would indicate. At this juncture, I wanted to look at the entire history of the CEF since inception. Perhaps the past 5 years was just an anomaly, and that the CEF has commanded a consistent premium in the past? It turns out that was not so. Going back to inception, only during a brief period in 2009 did the fund"s premium exceed 10%. An unusually high premium for an investment grade fund might be understood during the immediate recovery period after the financial crisis...but why now? I can"t think of a fundamental reason why someone would pay $ 1.10 for a dollar of investment grade debt. I then check out the premium/discount values of the peer group. Maybe investment grade bond CEFs are for some reason on a tear thus accounting for PAI"s unusual premium? Nope, that"s not it. The premium of PAI is 3rd-highest out of the 15 CEFs in the "investment grade" category of CEFConnect. But I don"t consider PIMCO Corporate & Income Strategy Fund (PCN) and PIMCO Corporate & Income Opportunity Fund (PTY) to be traditional investment grade income CEFs, so not counting those two funds PAI has the highest premium in the peer group. (Source: Stanford Chemist, CEFConnect) OK, so PAI is a pretty good sell or short candidate. What did I pair my short PAI position with? What did I pair my short PAI position with? I chose the BlackRock Credit Allocation Income Trust (BTZ). I wanted to choose a fund with a negative z-score, but rather amazingly all 15 investment grade CEFs had z-scores 0 or greater. BTZ"s z-score of +0.8 wasn"t the lowest, but its discount of -9.04% was the widest in the peer group, as you can see from the chart above. Next, I wanted to see compare the price and NAV returns of these two investment grade bond CEFs to check if there were signs of deteriorating portfolio values in the undervalued CEF, which might cause me to consider BTZ as the long partner in this pairs trade. The opportunity for the pairs trade comes from the fact that PAI"s price return is significantly outpacing its NAV return, whereas that is not the case with BTZ. We can see from the chart below that PAI appears to be blowing BTZ out of the paper with a +19.29% YTD return compared to only +8.94% for BTZ. However, their YTD NAV returns are nearly identical. No warning signs there. That leads me to the conclusion that: In summary, if you own PAI, now would be a great time to sell! Let"s see how the thesis played out 4.5 months later. BTZ had a total return loss of -3.88% over this time frame. That"s bad, of course, but still relatively much better than PAI"s loss of -14.1% over the same period. In other words, BTZ outperformed PAI by 10.22 percentage points in only 4.5 months, or about 27% annualized. Did PAI"s portfolio do much worse than BTZ"s? No, and in fact the reverse was true. PAI"s net asset value [NAV] fell by -2.10% over this time period, but BTZ"s was even worse at -3.24%. This article hopefully conveys our thought process in recommending a pairs trade to our members. Anyone who owned PAI and swapped to BTZ to would have profited to the tune of ~10% in only 4.5 months (~27% annualized), which is equivalent to about 2.5 years worth of distributions from PAI! Note that I did not need to do a deep dive analysis of either PAI or BTZ to initiate this pairs trade. This was based almost entirely on premium/discount mean reversion, or as my fellow SA author Arbitrage Trader likes to say, "simple statistics". Taking stock of the situation today, the long BTZ/short PAI trade has to be considered to be largely completed, as PAI is now trading with a discount of -4.82% and a 1-year z-score of -1.5, indicating that is now cheaper than its historical average. Although BTZ"s z-score of -2.5 is even lower, as is its discount (-11.9%), the gap in valuation is no longer there. Are there any current opportunities? The following table shows the 12 CEFs in the database that currently have z-scores greater or equal to +2.5. If you own ones of these funds, if might be a good idea to seek out another fund in the same category that is trading with a more attractive valuation, particularly if the fund that you own is also trading at a premium. Don"t let mean reversion catch you out! Western/Claymore Infl-Lnk Opps (Source: CEFConnect, Stanford Chemist) If you have enjoyed my article, please click the "Follow" button next to my name to be alerted to my new free content! The Cambridge Income Laboratory is my Marketplace service on Seeking Alpha focused on income and arbitrage strategies for closed-end fund (CEF) and exchange-traded fund (ETF) portfolios. Members receive exclusive subscriber articles and an early look at public content with more actionable recommendations and ideas. We’re currently offering a limited time only free trial for the Cambridge Income Laboratory. Prices are going up on March 1, 2018, so please join us and lock in a lower rate for life by clicking on the following link: Cambridge Income Laboratory. Disclosure: I/we have no positions in any stocks mentioned, and no plans to initiate any positions within the next 72 hours. I wrote this article myself, and it expresses my own opinions. I am not receiving compensation for it (other than from Seeking Alpha). I have no business relationship with any company whose stock is mentioned in this article. Additional disclosure: I am long the portfolio securities.

Summary
Name Ticker Yield Discount z-score MS Income Securities (ICB) 2.71% -1.47% 3.9 BlackRock Science and Technolo (BST) 5.32% 3.05% 3.2 Tortoise MLP Fund (NTG) 8.61% 9.26% 3.2 ClearBridge Energy MLP (CEM) 8.85% 5.53% 3.1 Gabelli Utility Trust (GUT) 8.50% 44.95% 3.1 Templeton Emerging Mkts Income (TEI) 3.79% -8.17% 3.1 Sprott Focus Trust (FUND) 4.97% -8.86% 3.0 Nuveen S&P Dynamic Overwrite (SPXX) 5.58% 9.54% 2.9 RiverNorth Opportunities Fund (RIV) 12.09% 6.83% 2.7 Deutsche High Income Oppos (DHG) 5.42% -0.60% 2.6 First Trust New Opps MLP & En (FPL) 10.52% 6.67% 2.5 (WIW) 3.79% -9.71% 2.5 Cambridge Income Laboratory: CEF and ETF Income and Arbitrage Strategies
Tech
Sunday, February 18, 2018
Here's Why You Shouldn't Pay $1.10 For A Dollar Of Investment Grade Bond Assets


Subscribe to:
Post Comments (Atom)
No comments:
Post a Comment