Breakout Forecast Selections for Week 9:
Market conditions continue to show signs of recovery. Readers are cautioned that negative conditions are still strong, but have been significantly reduced. My momentum gauge is based on the size of the list of screened momentum stocks. The negative momentum indicator list is showing above average numbers at 35, but down from the prior week with 40. The positive momentum indicator has moved up significantly from all time lows. All time low for positive momentum selections is 10 (during week 6) and all time high is 120 (last August). The current positive momentum measure is still quite low at 35, but up from 30 in the prior week.
Additional selections from last week"s separate technical articles also showed double-digit returns in a short trading week: AGEN +16.32% and DRNA +19.98%


This week I have selected 8 breakout stocks from the following sectors: 5 healthcare, 2 basic materials, and 1 services. I continue to see strong signals of breakouts across the biotech sector as I described in my last sector report.
The two new selections of positive momentum stocks for this week include:
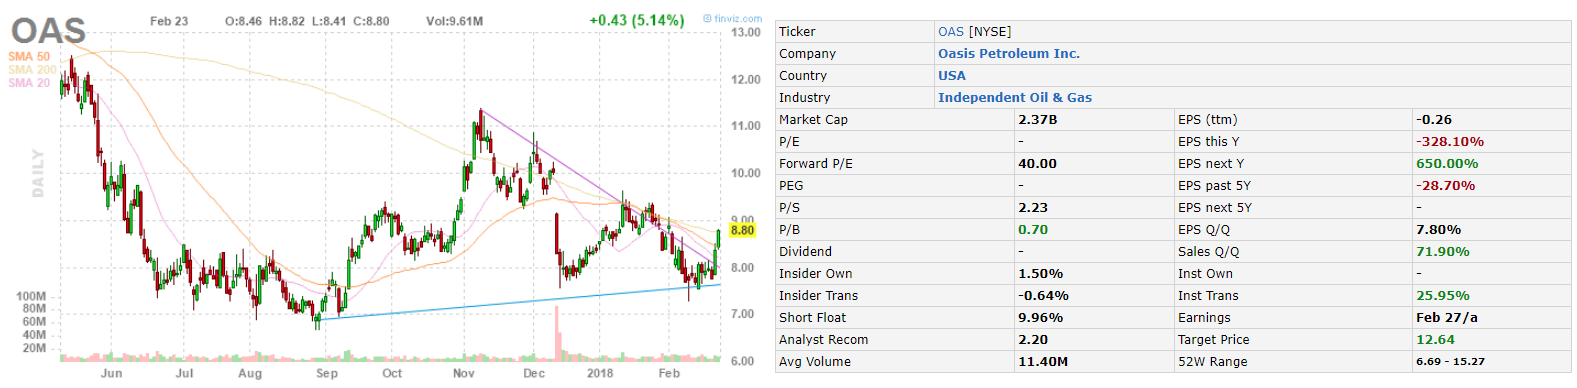
- Oasis Petroleum, Inc. (OAS) - Basic Materials / Independent Oil & Gas
- Senseonics Holdings, Inc. (SENS) - Healthcare / Medical Appliances
These stocks are not necessarily recommended for long term buy/hold unless you are comfortable with very large price swings. As I continue to observe, strong momentum events usually last from one to three weeks and may encounter some substantial decline before returning again to positive gains.
These are the most volatile selections I offer from among all the different Value & Momentum portfolios. Proposed entry points for each of the selected stocks are as close to the highlighted prices in yellow on the charts at market open. All stocks are selected for high short-term breakout results over one to three weeks.
Breakout Stock Charts for Week 9
Pick #1: Oasis Petroleum, Inc. (OAS) - Basic Materials / Independent Oil & Gas
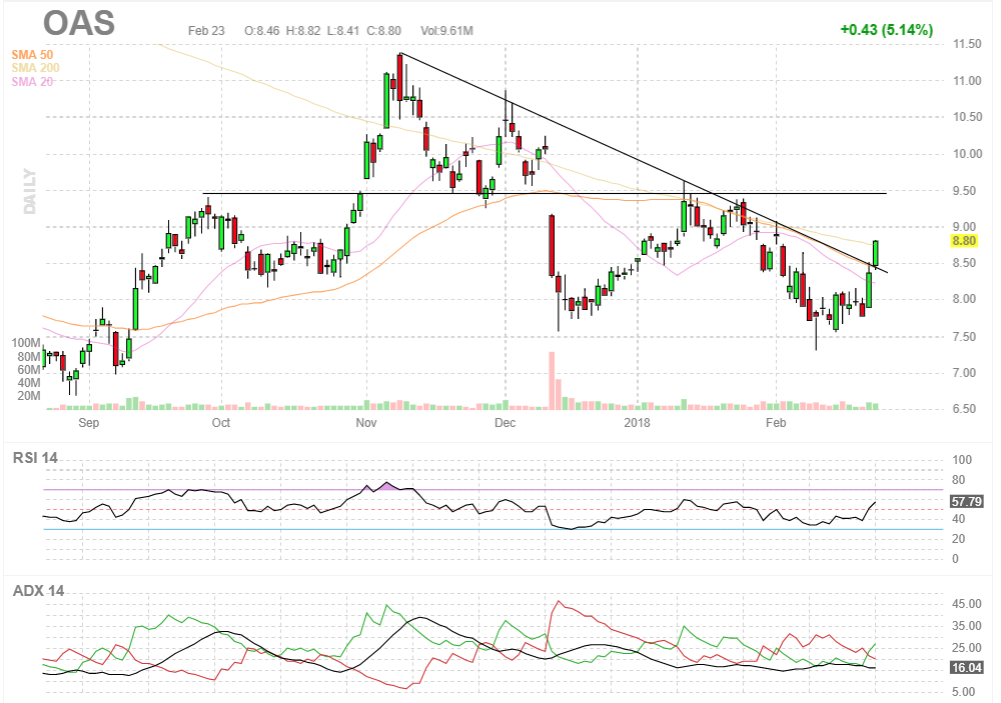
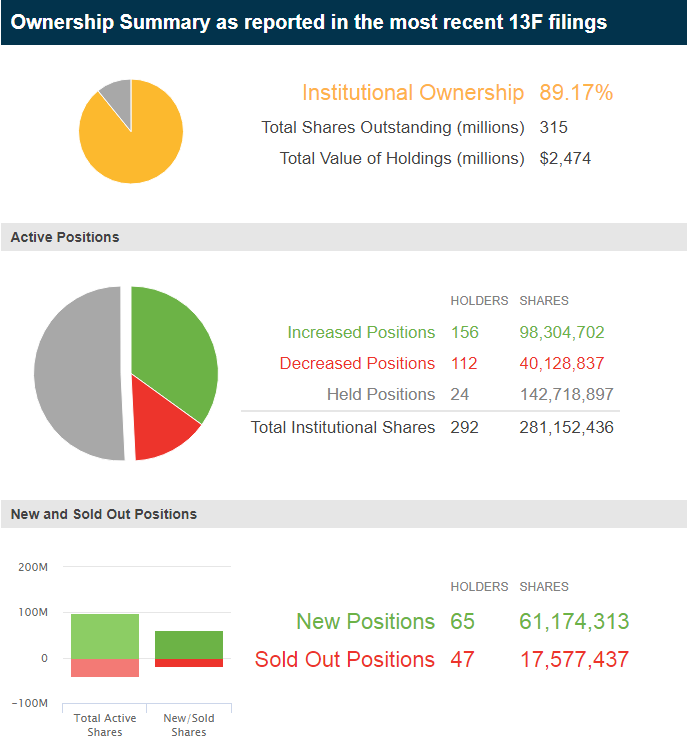
Significant institutional ownership increases in latest 13F filings:
Target price: $11.00
Pick #2: Senseonics Holdings, Inc. (SENS) - Healthcare / Medical Appliances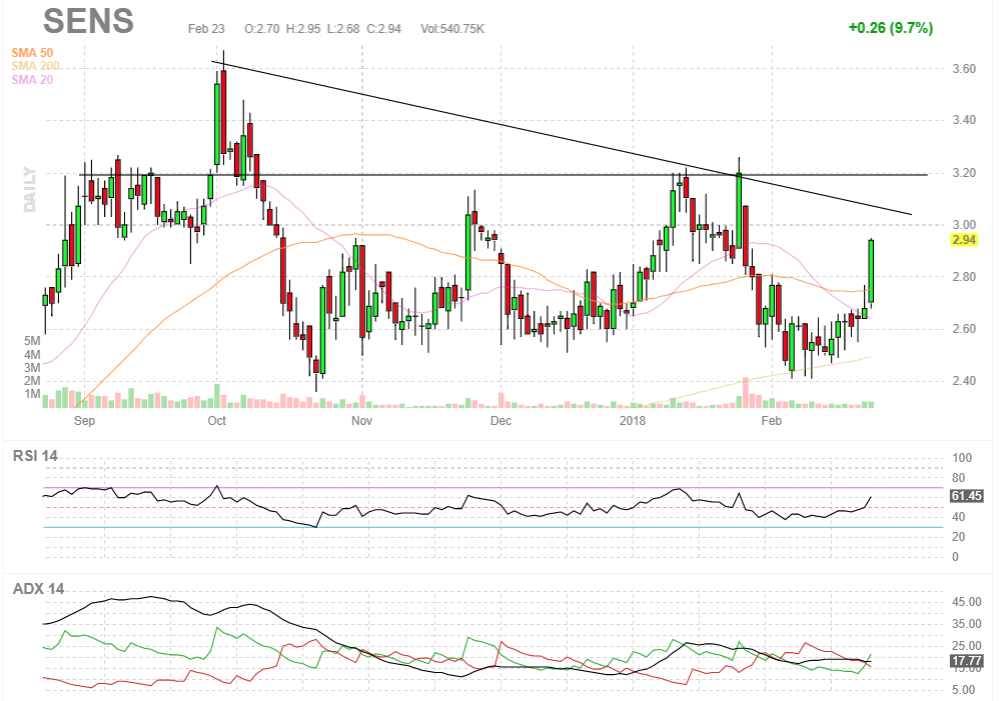
Significant institutional ownership increases in latest 13F filings:

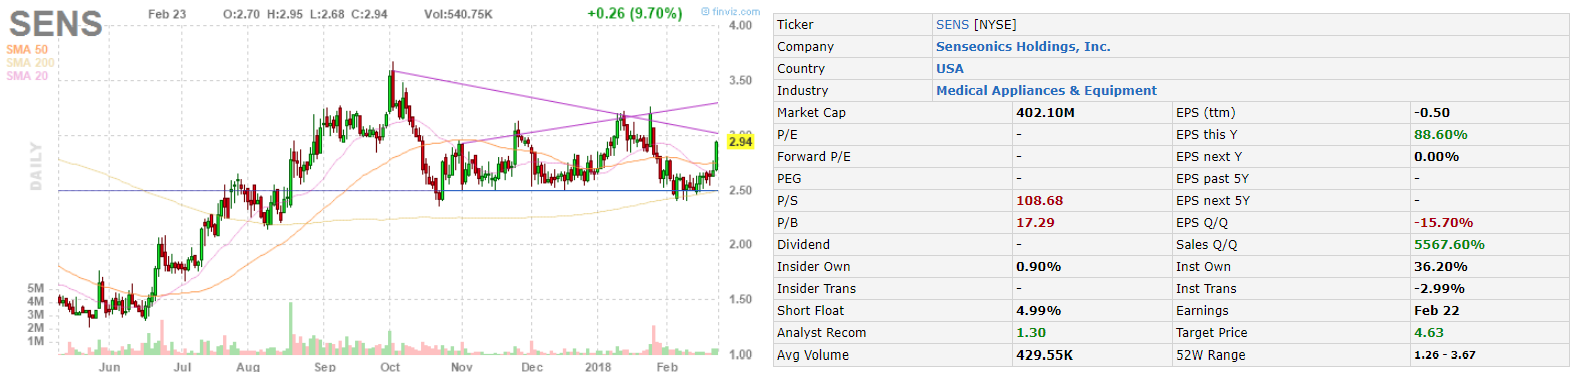
Target price: $3.40
Breakout Forecast Performance Results:
Total Return Chart: +52.77%

Total Breakout portfolio returns by week for the past 5 weeks are listed below through the end of last week to illustrate the rolling returns of prior top performers and total portfolio returns:
| Breakout Forecast | Portfolio gains past 5 weeks / Top 3 Performing Stocks |
| Week 8 | +3.79% / (FATE) +34.71%, (DRNA) +19.98%, (RUN) +0.51% |
| Week 7 | +8.19% / (EGAN) +36.60%, (FLDM) +11.09%, (EROS) +10% |
| Week 6 | +1.47% / (SRNE) +18.95%, (HAIR) +18.64%, (PIRS) +6.44% |
| Week 5 | -2.79% / (QNST) +37.72%, (STAA) -5.47%, (CNAT) -5.50% |
| Week 4 | -1.39% / (AGEN) +27.46%, (INVA) +8.56%, (WK) +0.45% |
For those who are new to this short-term selection method I would highly recommend that you review the end of year performance summary and the links to methodology articles about how these high volatility, typical low cap, breakout selections work. Basically, I am trying to maximize the frequency of substantial positive returns using the parameters that resulted from my published doctoral research by focusing on the most volatile sector of stocks.
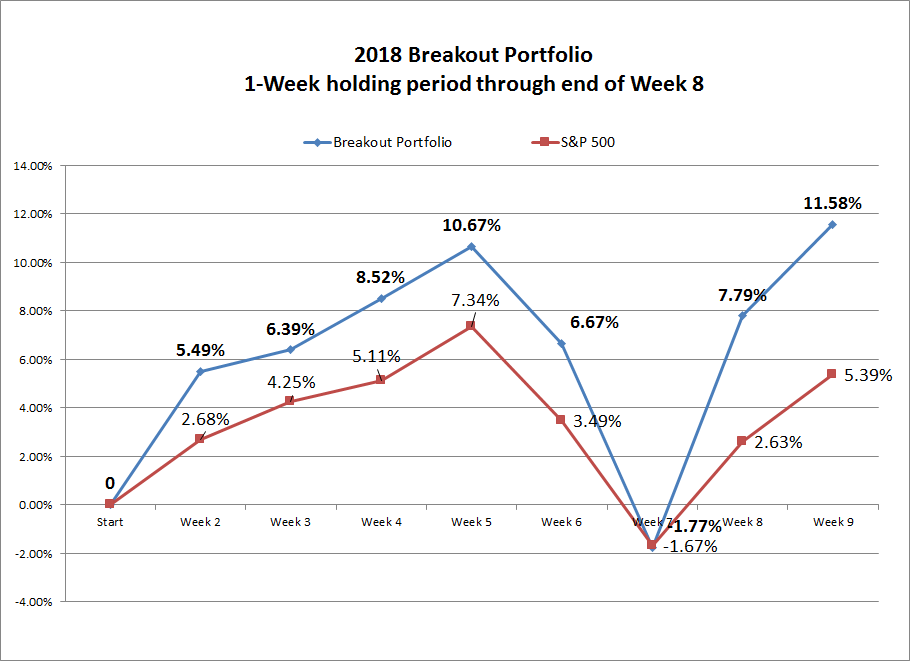
2018 YTD Chart: +11.58%
Cumulative return with 1-Week holding period.
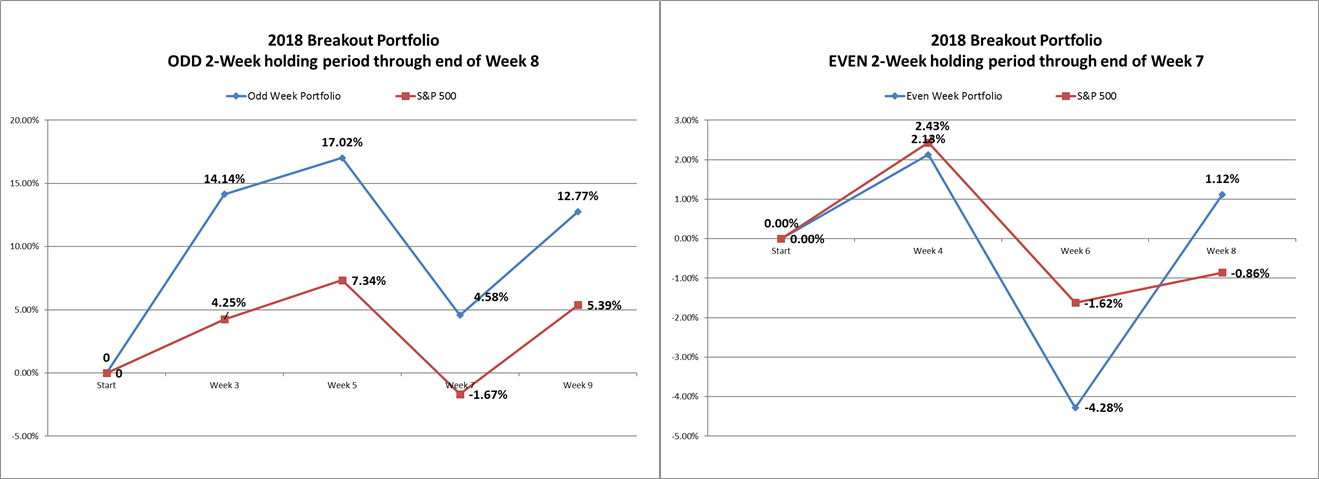
The next charts shows the cumulative return for a longer fixed 2-week holding period instead of the 1 week holding period charted above. Because 2-week holding periods overlap with weekly selections, I have separated it into two charts, Odd and Even weeks:
- Using 2-week holding periods, the ODD Weekly Breakout portfolios have returned 12.77% compared to 5.39% for the S&P 500 YTD over the same holding periods.
- The EVEN Weekly Breakout portfolios have returned 1.12% compared to -0.86% of the S&P 500 in the equivalent 2-week holding period.
Chart 1. Chart 2.
Additional Value & Momentum Portfolio Returns:
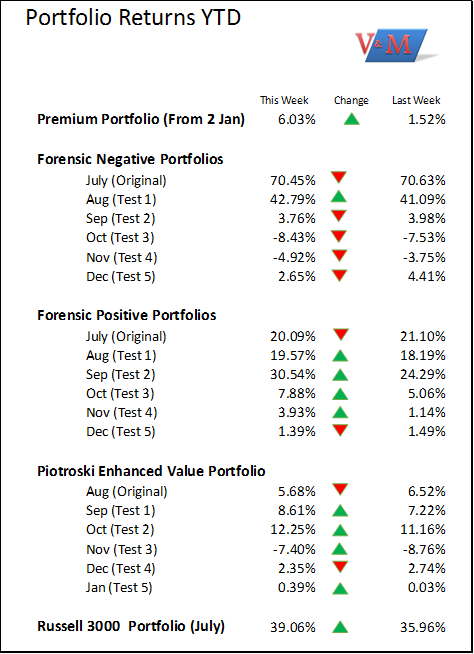
Full portfolio composition reports are exclusive to members, however additional articles on the different categories of portfolios and samples of research provided to subscribers are listed in my public research profile.
If you are interested in subscribing to any of the Value & Momentum Breakout portfolios offered you can visit my subscription page here. Otherwise please click the "Follow" button at the top of the page and enjoy free updates on the progress of each of the different portfolios I offer that are outperforming the S&P 500 in each of their respective time periods.
As always, I wish you the very best in all your investments!
JD Henning, PhD, MBA, CFE, CAMS
Disclosure: I am/we are long DRNA, EROS, FATE, EGAN, FLDM, PIRS.
I wrote this article myself, and it expresses my own opinions. I am not receiving compensation for it (other than from Seeking Alpha). I have no business relationship with any company whose stock is mentioned in this article.
No comments:
Post a Comment